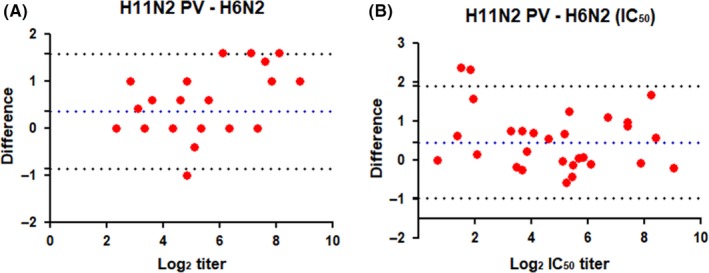
Figure 10.

Bland‐Altman plot of the differences between (A) H6N2/H11N2 PV Log2 end point and (B) IC50 titers. The mean difference of each value (red bullets) between the ELLA run with different sources of antigen is plotted, with the limit of agreement (±1.96 SD, stippled black line) and the overall mean of differences (bias, stippled dark blue line) are shown
