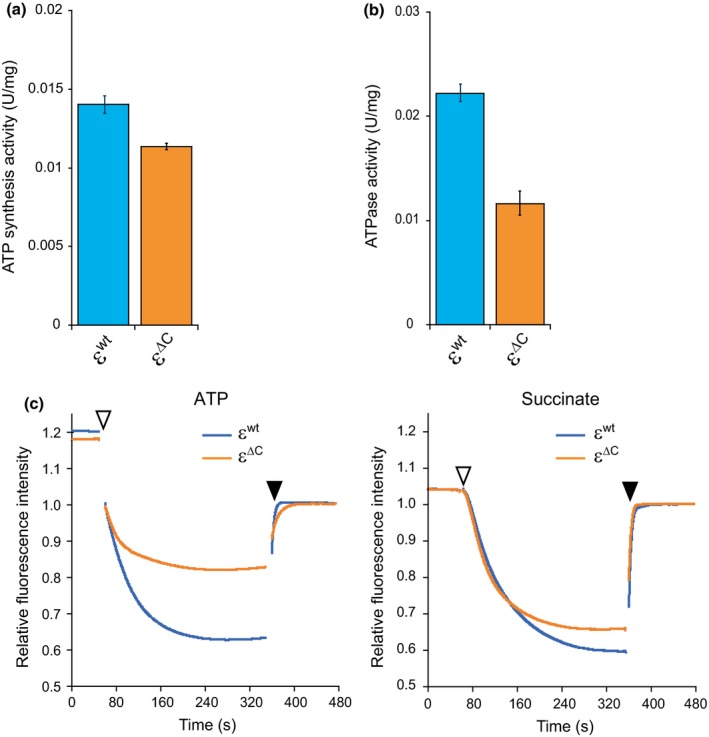
Figure 2.

Analysis of enzyme activities of BFoF1. IMVs prepared from the WT εwt and WT ε∆C mutant cells were used in the activity assays. (a) ATP synthesis by BFoF1, driven by the H+ electrochemical gradient across the membrane, was measured using a luciferin‐luciferase based assay method as described in the Materials and Methods. The enzyme activity needed to synthesize 1 µmol of ATP per min was defined as 1 unit. Data shown are ATP synthesis activity per mg of membrane protein. In (a) and (b), results shown are averages of three experiments and error bars indicate standard errors. The blue columns and orange columns indicate WT εwt and WT ε∆C, respectively. (b) ATP hydrolysis activity of the FoF1 was measured using a NADH‐coupled ATP regenerating assay method. The activity that hydrolyzed 1 µmol of ATP per min was defined as 1 unit. Data shown are ATP hydrolysis activity per mg of membrane protein. (c) H+‐pumping activities of FoF1 (left) and respiratory complex (right). Pumping activity was measured by monitoring quenching of fluorescence intensity of ACMA as described in the Materials and Methods. The assay reaction was initiated by adding either 2 mmol/L ATP (left plot) or 5 mmol/L succinate (right plot) at the times indicated by open arrow heads and terminated with the addition of CCCP at the times indicated by closed arrow heads. Fluorescence intensity after the addition of CCCP (at 480 s) was defined as 1. The blue lines and orange lines indicate WT εwt and WT ε∆C, respectively
