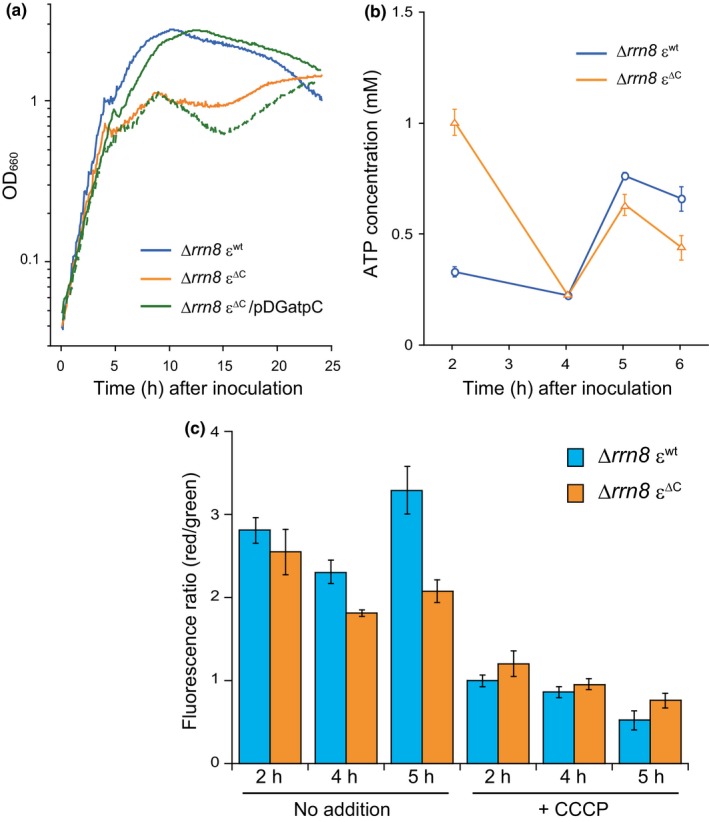
Figure 4.

Phenotypic analysis of the ∆rrn8 ε∆C mutant. (a) For growth curves, ∆rrn8 εwt (blue line) and ∆rrn8 ε∆C mutant (orange line) cells were grown in LB, and ∆rrn8 ε∆C /pDGatpC cells were grown in LB with (green solid line) or without (green dashed line). OD660 of each culture was measured every 5 min. (b) Cellular concentrations of ATP in the ∆rrn8 εwt (blue circles) and ∆rrn8 ε∆C (orange triangles) cells were determined as described above in the legend of Figure 3c. (c) Cells were grown in LB medium and harvested at the indicated times. Relative membrane potential in untreated and CCCP treated cells was measured as described above in the legend of Figure 3d. Cells with higher membrane potentials exhibited higher fluorescence ratios (red/green). In (b) and (c), results shown are averages of three independent experiments and error bars indicate standard errors.
