Figure 6.

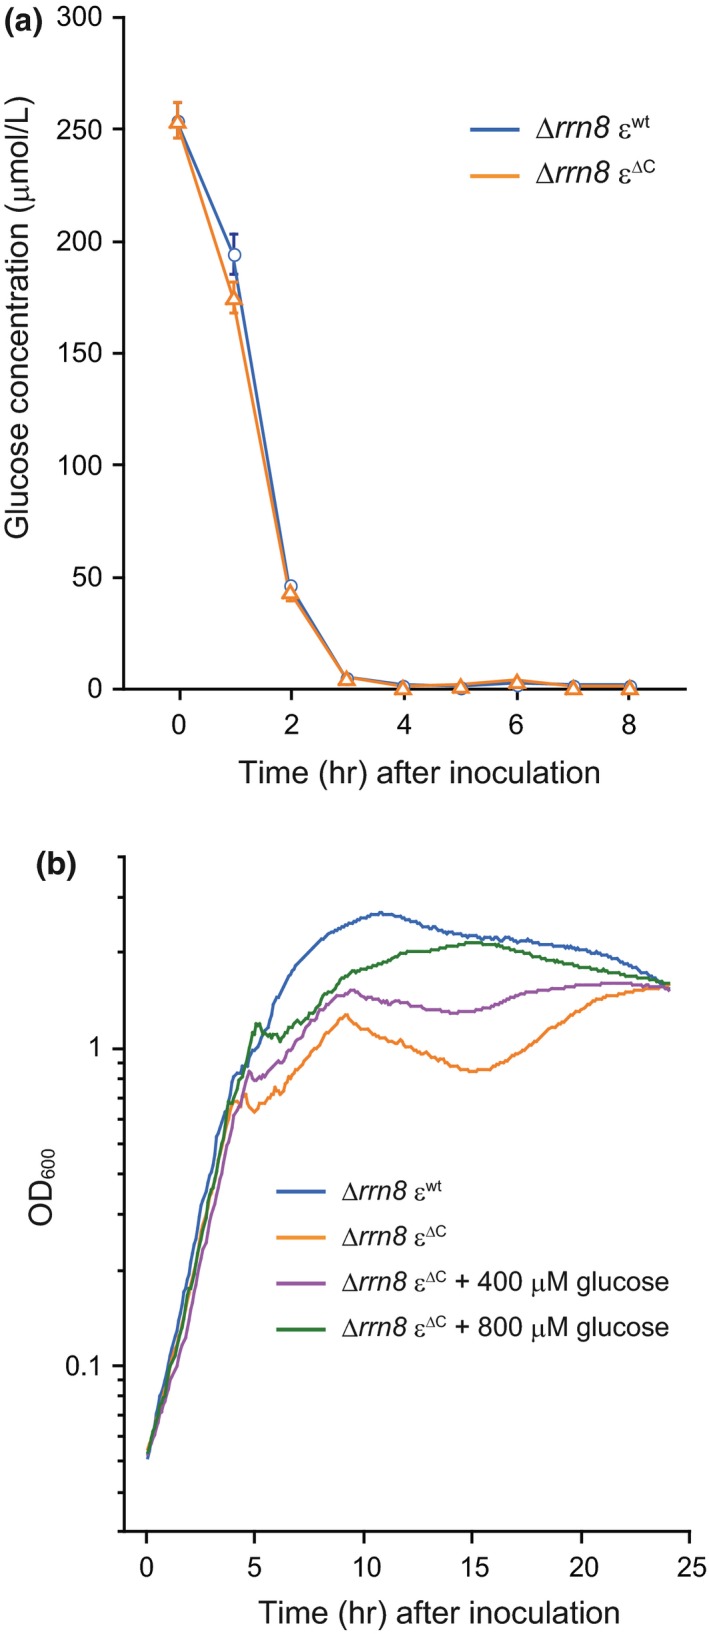
Relationship between the stalling of growth of ∆rrn8 ε∆C cells and glucose concentration in the culture. (a) Time dependent changes in the glucose concentration in the cultures of ∆rrn8 εwt (blue circles) and ∆rrn8 ε∆C (orange triangles) cells, which were grown in LB medium. The glucose concentration in the culture supernatant of cells harvested at the indicated times was measured as described in the Materials and Methods. Results shown are averages of three independent experiments. Error bars indicate standard errors. (b) The effect of addition of glucose on the growth of the ∆rrn8 ε∆C mutant. Growth curves of ∆rrn8 εwt and ∆rrn8 ε∆C cells grown in LB medium without any added glucose are shown using blue line and orange line, respectively. Growth curves of ∆rrn8 ε∆C mutant cells in LB medium supplemented with either 400 µmol/L (purple line) or 800 µmol/L (green line) glucose. OD660 nm of aliquots taken from the culture was measured every 5 min
