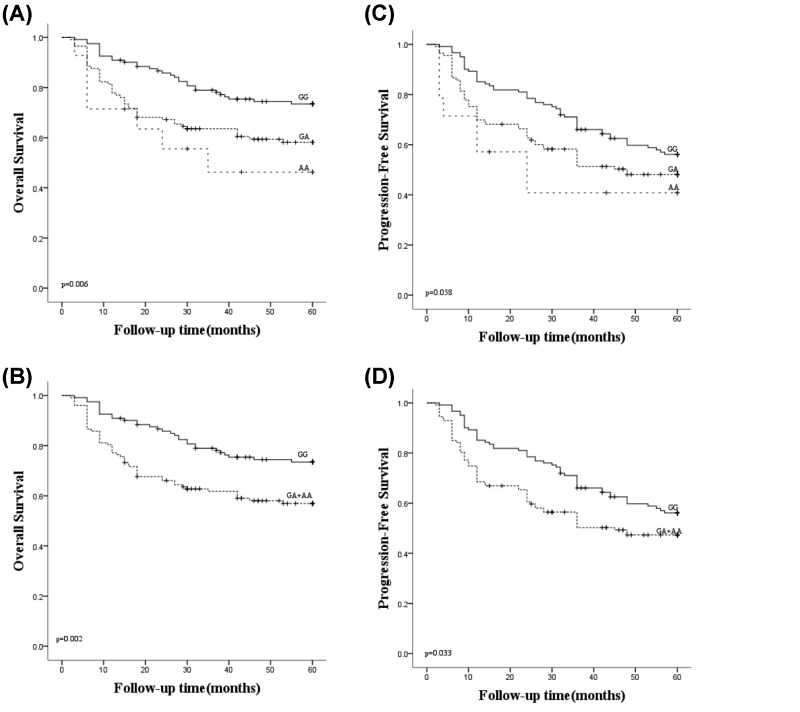
Figure 1. Survival analyses of DLBCL patients under the genotype of CREBBP rs3025684.
(A) OS analysis compared among the GG, GA and AA subgroups (P=0.006). (B) OS analysis compared between the GG subgroup and the combined GA/AA subgroup (P=0.002). (C) PFS analysis compared among the GG, GA and AA subgroups (P=0.058). (D) PFS analysis compared between the GG subgroup and the combined GA/AA subgroup (P=0.033). A check mark indicates that the data is censored.

