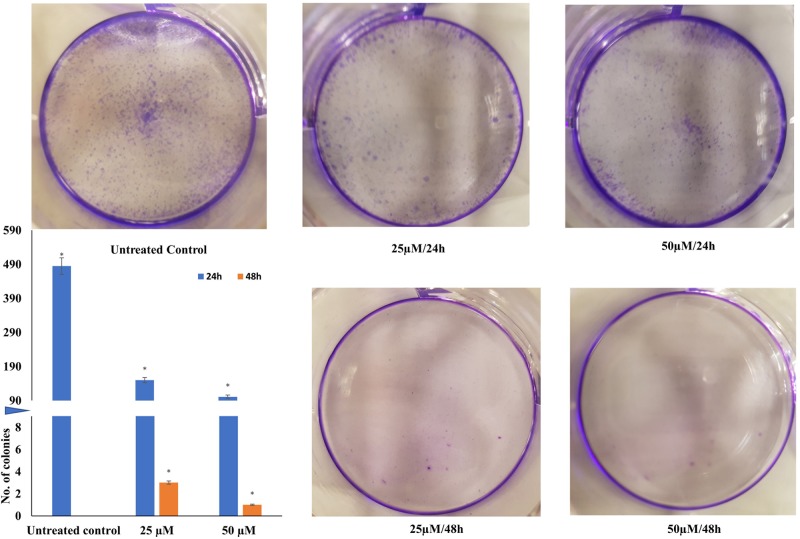
Figure 2. Colony formation assay: HeLa cells treated with different concentration (25, 50 µM for 24 and 48 h), counted (500 cells) and plated.
Colonies were monitored microscopically and photographed after 2 weeks. Colonies formed after 2 weeks were counted and the mean represented as a graph, which is inset. A split Y-axis graph has been used to clearly indicate all the values. Axis is split at value 8 and restarts at value 90 (*P≤0.05).

