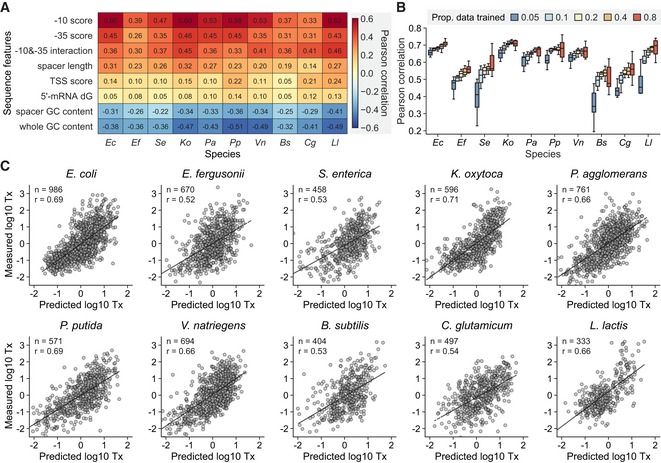
Correlation between sequence features of regulatory sequences and transcriptional activities in each bacterial species.
Correlation between predicted and measured transcription levels for each bacterial species with various proportions of data for model training. Data were randomly split for the training and test sets, respectively, and Pearson correlation between predicted and observed transcription levels was computed for 10 times for each proportion. Box plots are displaying the interquartile range (IQR) with median values (black line) and whiskers extending to the highest and lowest points within 1.5× of the IQR.
Example linear regression models for transcriptional activation (Tx) in 10 bacterial species using data generated through DRAFTS. Data were randomly split in 10 and 90% for the training and test sets, respectively. Dashed lines represent linear regression. Sample sizes (n) and Pearson correlation coefficients (r) are shown in each plot.
Data information: For normalization, transcription levels in log
10 scale were transformed to
Z‐score. All measurements are based on two biological replicates.
Source data are available online for this figure.

