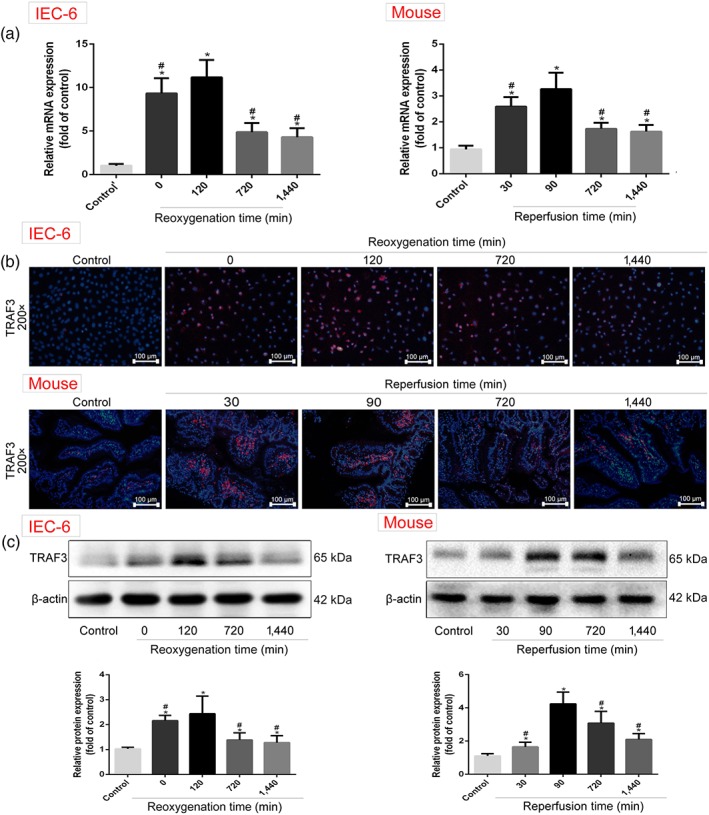
Figure 4.

TRAF3 expression levels in H/R‐caused IEC‐6 cells and II/R‐caused mice. (a) The mRNA levels of TRAF3 in IEC‐6 cells and mice based on real‐time PCR assay. (b) The protein levels of TRAF3 in vitro and in vivo based on immunofluorescence staining (200× magnification). (c) The protein levels of TRAF3 in vitro and in vivo based on western blotting assay. All data are expressed as the mean ± SD (n = 5). *P < .05 compared with control group or sham group; # P < .05 compared with 120 min of reoxygenation or 90 min of reperfusion group
