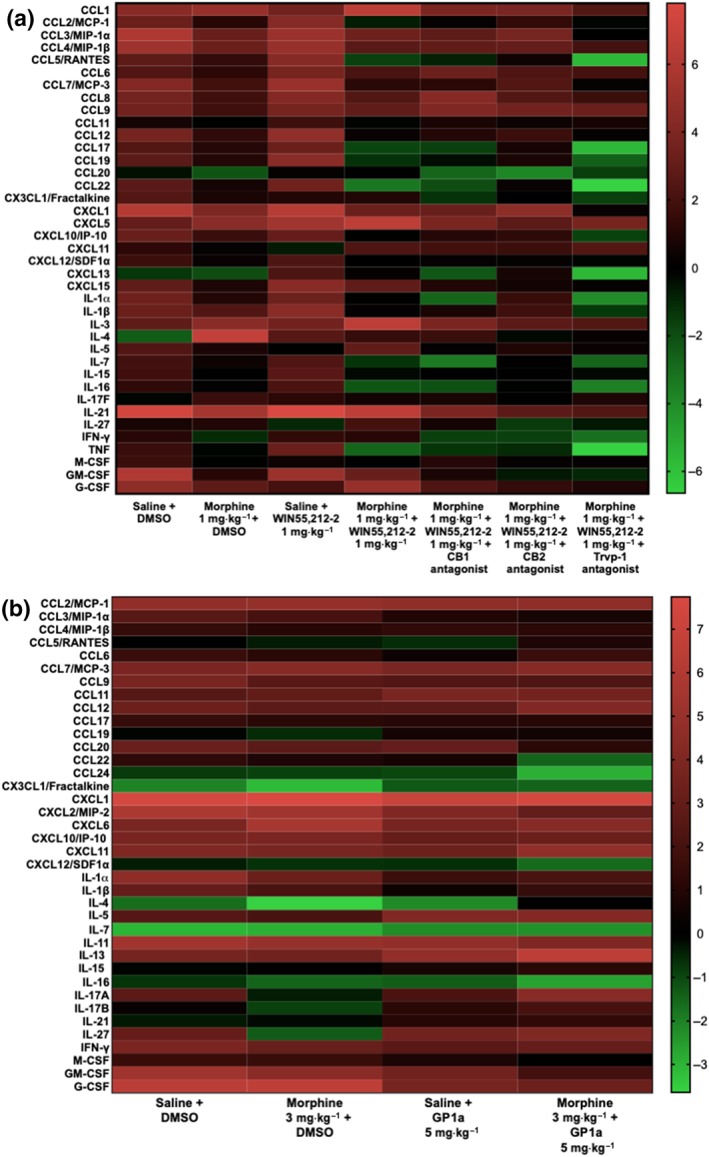
Figure 6.

Change in mRNA expression in popliteal lymph nodes of mice receiving formalin or rats receiving carrageenan in the foot pad, with and without morphine or cannabinoid treatments. Heat maps show the changes in mRNA expression for panels of chemokines and cytokines, with or without treatments, compared with untreated, baseline popliteal lymph nodes. The scale is shown to the right of the graphs. Red indicates up‐regulation compared to baseline. Black represents no change. Green indicates down‐regulation of mediators. (a) Samples of tissue from mice injected with formalin into the foot pad and given different treatments. Each bar represents relative amounts of mRNA in a pooled extract of two mice per group. (b) Samples of tissue from rats injected with carrageenan into the foot pad and given different treatments. Each bar represents relative amounts of mRNA averaged from two arrays performed on samples from two different rats in each group
