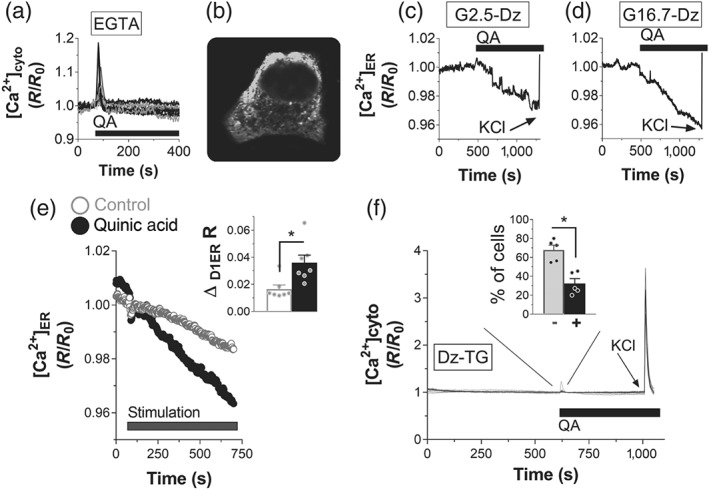
Figure 3.

Quinic acid (QA) promotes Ca2+ rise, acting on intracellular Ca2+ stores. (a) Representative traces of cytosolic Ca2+ rise in INS‐1E pancreatic β cells, transfected with the YC3.6cyto (n = 5). The cells were depleted of external Ca2+ by adding 0.5‐mM EGTA in a medium without Ca2+, and then they were stimulated with 100‐μM QA. (b–e) QA promotes Ca2+ release from the endoplasmic reticulum (ER). (b) ER Ca2+ fluorescence was measured with the D1ER sensor (signal recorded at 535 nm). Depletion of ER Ca2+ by 100‐μM QA in INS‐1E cells in the presence of (c) 2.5‐ or (d) 16.7‐mM glucose. The averaged ER signals of the cells in one coverslip are representative of five independent experiments for both (c) and (d). Diazoxide (Dz; 100μM) was included in the bath to avoid the contribution of the plasma membrane Ca2+ influx. KCl (30 μM) was added as indicated. (e) Average of ER Ca2+ signals in INS‐1E cells transfected with the D1ER sensor and then stimulated with Krebs–Ringer bicarbonate HEPES buffer or 100‐μM QA in a medium depleted of external Ca2+ (EGTA 0.5 mM). Statistical evaluation of the amplitude of ER Ca2+ depletion after 10′ stimulation. Data shown are individual values with means ± SEM from n = 7 experiments for both control and QA‐stimulated cells. *P <.05, significant effect of QA; Student's t test. (f) Evaluation of the contribution of intracellular Ca2+ stores to QA‐dependent cytosolic Ca2+ rise. INS‐1E cells, transfected with YC3.6cyto, were incubated in Krebs–Ringer bicarbonate HEPES buffer in the presence of 100‐μM Dz and 1‐μM thapsigargin (TG) to deplete ER Ca2+. Then 100‐μM QA was added to measure the possible contribution of other intracellular Ca2+ stores to the cytosolic Ca2+ elevation. KCl (30 μM) was added as indicated. Single‐cell traces of one representative experiment from n = 5 experiments. The inset shows the number of cells showing (+) or not showing (−) QA‐dependent cytosolic Ca2+ rise. Data shown are individual vales with means ± SEM from n = 5 experiments. *P <.05, significantly different as indicated; Student's t test
