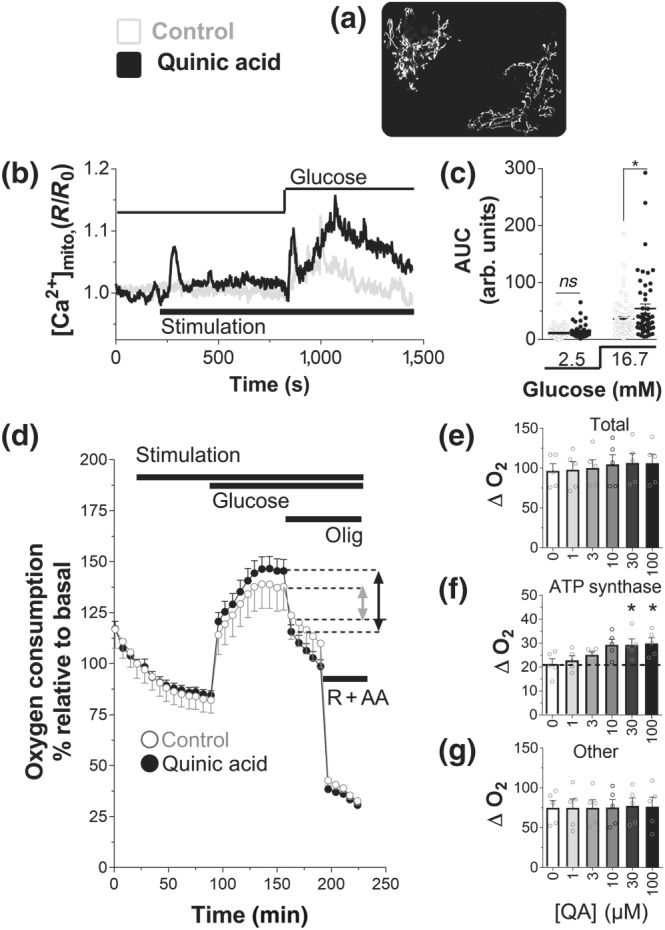
Figure 4.

Quinic acid (QA) boosts mitochondrial Ca2+ rise and enhances mitochondrial ATP synthase‐dependent respiration, during glucose stimulation. (a) Mitochondrial fluorescent pattern measured with the mitochondrial Ca2+ sensor 4mtD3cpv, recorded at 535 nm. (b) Representative traces mitochondrial Ca2+ rise in INS‐1E cells, transfected with the 4mtD3cpv. The cells were stimulated with Krebs–Ringer bicarbonate HEPES buffer (KRBH; control [Ctrl]) or 100‐μM QA (in basal 2.5‐mM glucose, and then 16.7‐mM glucose was added (Glucose). (c) Statistical evaluation (scatter plot) of the effect of QA on the amplitude of the mitochondrial [Ca2+] signal in basal (2.5‐mM) glucose or evoked by 16.7‐mM glucose. (b) Traces and (c) scatter points are representative or single points with mean ± SEM, respectively, of 62 cells (n = 5; Ctrl) and 51 cells (n = 5; QA). *P <.05, significant effect of QA; Student's t test. (d–g) Oxygen consumption in INS‐1E cells, assayed in standard KRBH, containing 2.5‐mM glucose. (d) Time course of INS‐1E cells treated with KRBH (Ctrl) or QA (10 μM) as indicated (Stimulation), in basal (2.5‐mM) glucose. Then glucose was added to a final concentration of 16.7 mM (Glucose), and then mitochondrial respiration was inhibited with oligomycin (Olig, 2.5 μg·ml−1) and then rotenone (R, 1 μM) + antimycin (AA, 1 μg·ml−1). Representative trace of five independent experiments. Summary data of the effect of the QA at the indicated concentrations on (e) the total respiration, (f) ATP synthase‐dependent respiration, and (g) other respiration. (e–g) Values shown are means ± SEM from n = 5 experiments. *P <.05, significant effect of QA ; one‐way ANOVA
