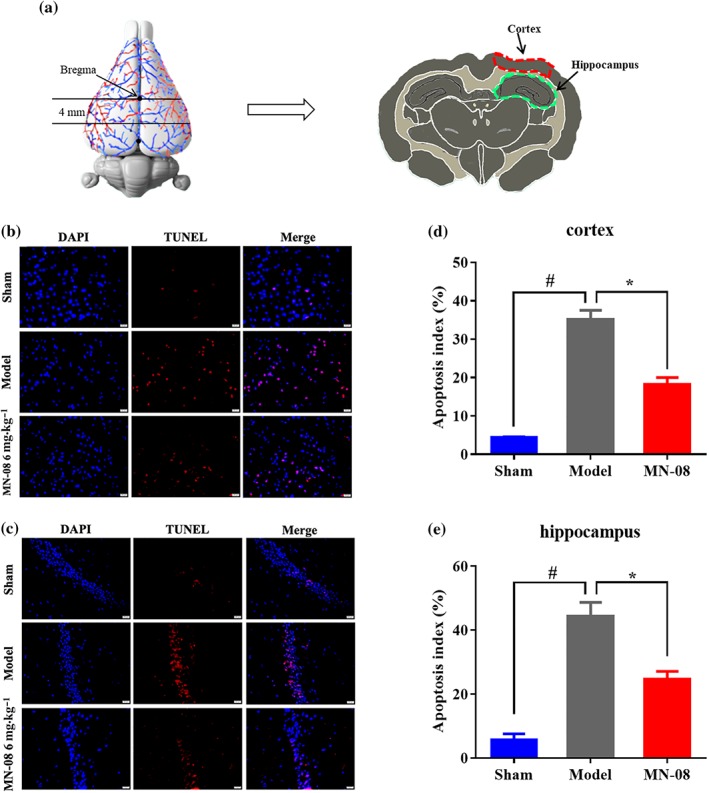
Figure 9.

MN‐08 reduced neuronal cell apoptosis in the rabbit cerebral cortex and hippocampus after SAH. (a) The tested region, the outlines in red and green area were manual annotations of the cortex and hippocampus respectively. (b, c) Representative photographs of TUNEL/DAPI double staining of the rabbit cortex and hippocampus after SAH. Scale bars: 20 μm; magnification, ×400. (d, e) Quantification of TUNEL‐positive cells in cortex and hippocampus. Data shown are means ± SEM (n = 6). # P < .05, significantly different from sham group; *P < .05, significantly different from model group; one‐way ANOVA and Dunnett's multiple comparisons test
