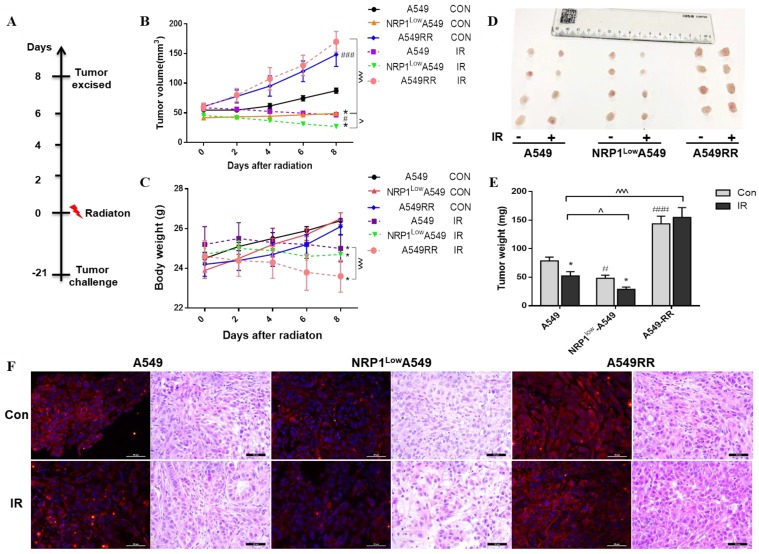
Figure 2.
Construction and analysis of the A549, NRP1LowA549 and A549RR mouse tumor model. Establishment of the mouse tumor model and treatment regimen (A). Tumor volume over the course of treatment (B). Body weights of mice in each group afther the radiaton treatment (n = 6/group). Data are expressed as the mean ± standard deviation. (C). Solid tumors excised from mice (D). Tumor weight of each group (E). NRP1 expression and Histopathology photographs of the tumor tissues in the nude mice in the 6 groups (F). #p<0.05,###p<0.001 vs A549 group; *p<0.05 vs control group; ^p<0.05,^^^p<0.001 vs A549 IR group.

