Figure 3.
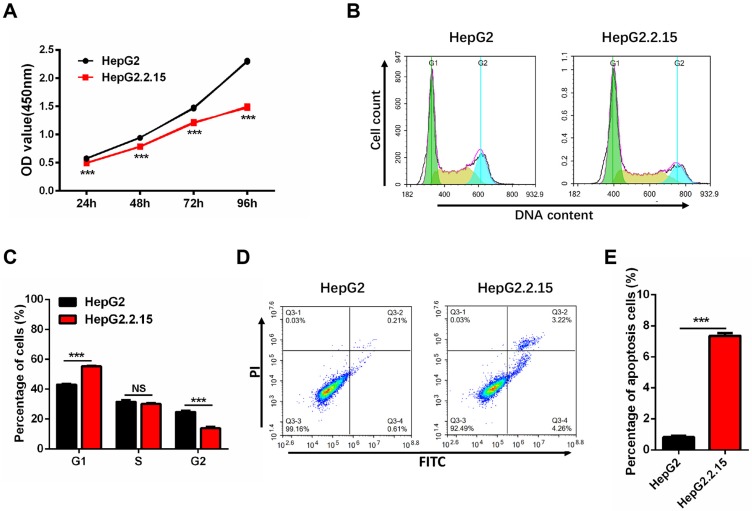
HepG2.2.15 cells show decreased proliferation, G1 cell cycle arrest and increased apoptosis. (A) Proliferation of HepG2 and HepG2.2.15 cells. OD450 values were measured at 24 h, 48 h, 72 h and 96h. Data shown represents the mean ± SEM values from three independent experiments (***p < 0.001). (B) Cell cycle analysis of HepG2 and HepG2.2.15 cells. (C) Quantitative cell cycle distribution of HepG2 and HepG2.2.15 cells. HepG2.2.15 cells show G1 cell cycle arrest when compared to HepG2 cells. Data shown represents the mean ± SEM values from three independent experiments (***p < 0.001, NS: none significant). (D) Analysis of cell apoptosis by flow cytometry. Increased apoptosis is observed in HepG2.2.15 cells. (E) Quantitative results of cells undergoing apoptosis in HepG2 and HepG2.2.15 populations. Data shown represents the mean ± SEM values from three independent experiments (***p < 0.001).

