Figure 2.
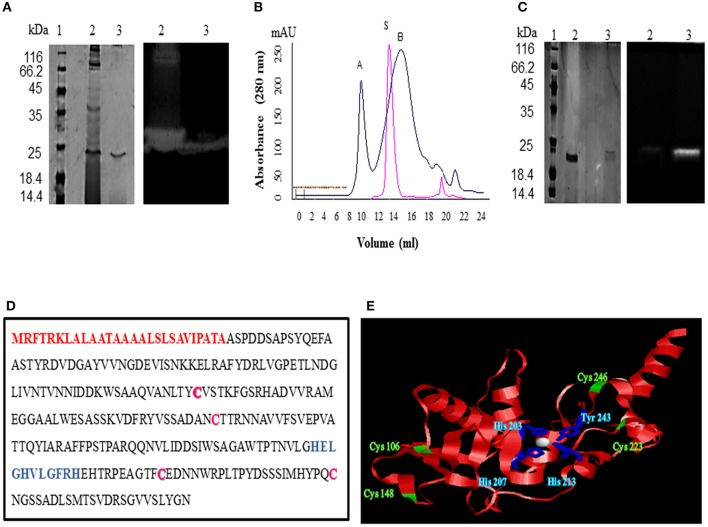
Purification and identification of protease from Microbacterium sp. SKS10. (A) 12% SDS-PAGE (left) and casein zymogram (right) of ammonium sulfate precipitated and GPC purified protease [Lane 1: molecular weight marker, lane 2: ammonium sulfate precipitated fraction, lane 3: GPC purified protease (peak B from B]. (B) Overlay of elution profiles of protease (black) and chymotrypsin (red) on gel permeation chromatography. (C) 12% SDS-PAGE (left) and casein zymogram (right) of protease under reducing and non-reducing conditions. (Lane 1: molecular weight marker, lane 2: protease in reducing conditions, lane 3: protease in non-reducing conditions). (D) Protein sequence of protease identified as Peptidase M16 by mass spectrometry. Signal peptide (1-27) is shown in red, cysteine residues are in pink whereas HEXXHXXGXXH motif is highlighted in blue. (E) Structure modeled by Swiss-model using secreted protease C as a template. Cysteine residues are shown in green and residues His 203, His 207, His 213 and Tyr 243 chelating Zn (white sphere) are shown in blue.

