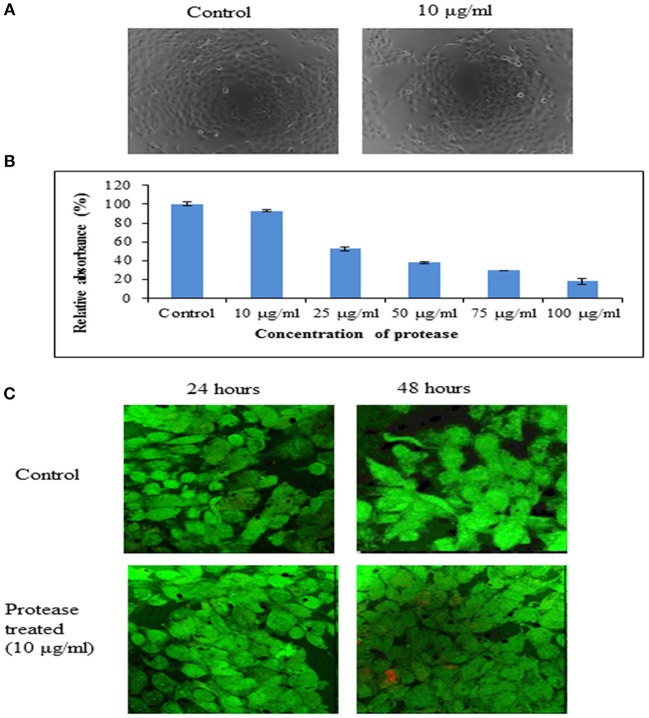
Figure 7.
Cytotoxicity of protease on A431 cells. (A) Representative phase contrast photo micrographs of A431 cells in control and cells treated with protease (10 μg/ml) for 24 h. (B) Bar diagrams representing cytotoxicity by MTT assay on A431 cells treated with 10–100 μg/ml of protease. (C) Proliferation of human epidermoid cells analyzed by live (green)/ dead (red) staining after 24 and 48 h of protease treatment studied by confocal microscopy.

