Figure 3.

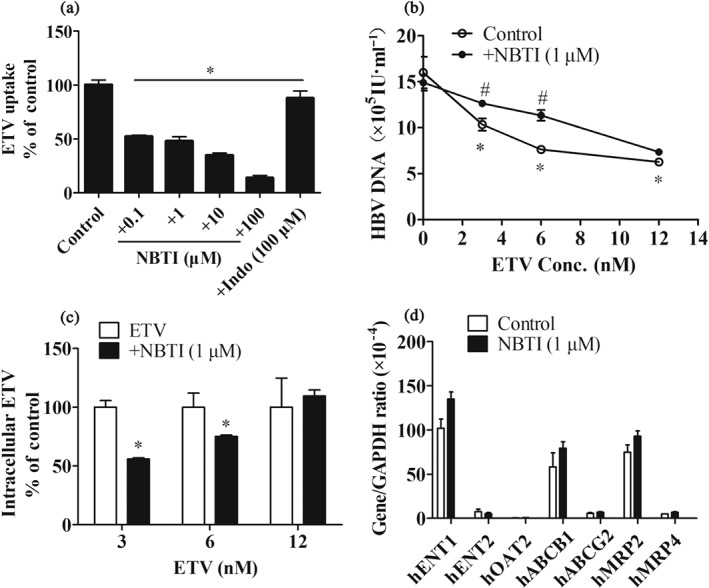
The role of ENT1 in the antiviral activity of ETV. (a) ETV accumulations in HepG2.2.15 cells in the absence or presence of the indicated concentrations of NBTI and Indo. n = 5. *P < .05 in comparison with ETV‐alone group. (b) The effect of NBTI (1 μM) on the level of HBV DNA in HepG2.2.15 cell supernatant. HepG2.2.15 cells were treated with the indicated concentrations of ETV with or without NBTI for 6 days. n = 5. *P < .05 in comparison with vehicle group; # P < .05 in comparison with ETV‐alone group. (c) Intracellular ETV concentrations in HepG2.2.15 cells treated with or without NBTI for 6 days. n = 5. *P < .05 in comparison with ETV‐alone group. (d) Gene expression of influx and efflux transporters in HepG2.2.15 cells after being treated with vehicle or NBTI (1 μM) for 6 days
