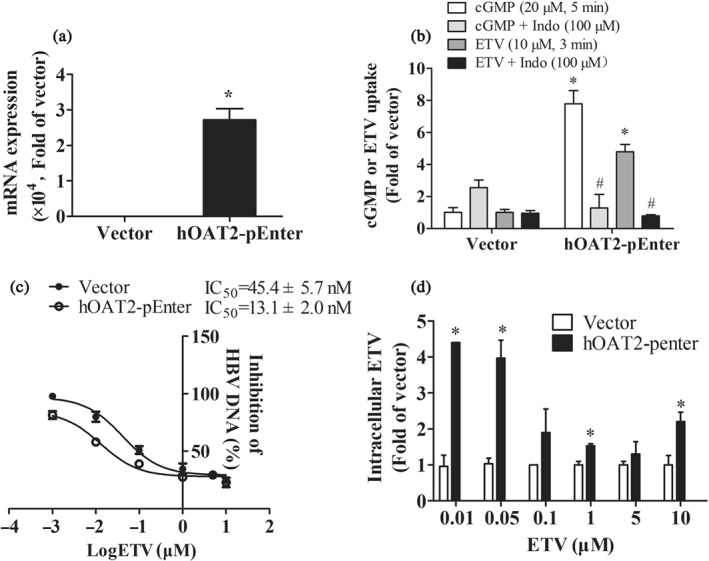
Figure 4.

The role of OAT2 in the antiviral activity of ETV. (a) The mRNA expression of hOAT2 in HepG2.2.15 cells transfected with hOAT2‐pEnter and corresponding vector for 96 hr. n = 5. *P < .05 in comparison with vector group. (b) Accumulations of cGMP and ETV in HepG2.2.15 cells transfected with hOAT2‐pEnter and corresponding vector for 96 hr in the absence or presence of Indo. n = 5. *P < .05 in comparison with vector group; # P < .05 in comparison with the accumulation in cells transfected with hOAT2‐pEnter without inhibitor. (c) The antiviral activity and (d) intracellular concentration of ETV in HepG2.2.15 cells transfected with hOAT2‐pEnter or corresponding vector for 3 days. n = 5. *P < .05 in comparison with vector group
