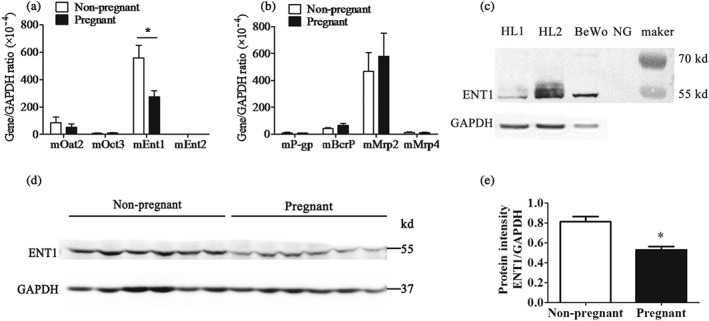
Figure 6.

The mRNA expressions of uptake (a) and efflux (b) transporters in the liver of non‐pregnant (n = 6) and pregnant mice (GD = 18.5, n = 6). (c) Human liver (HL) and BeWo cells were used as positive controls in western blot analysis, which verify that the protein band at ~55 kD position was mEnt1. (d) Protein expression of mEnt1 in the liver of non‐pregnant and pregnant mice (GD = 18.5); the band intensity was analysed with ImageJ software (e). n = 6. *P < .05 in comparison with non‐pregnant mice
