Figure 8.

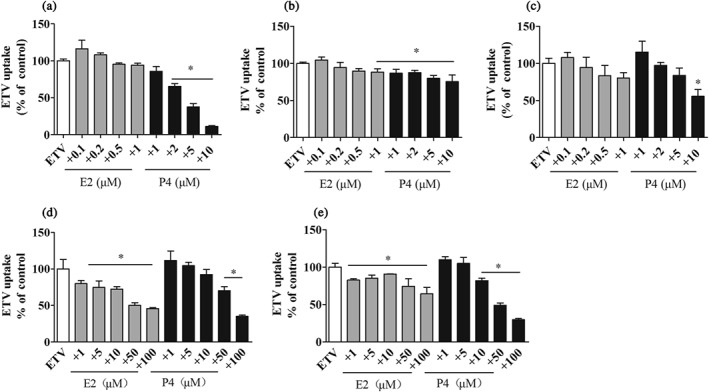
The inhibitory effects of E2 and P4 at the indicated concentrations on the uptake of ETV (20 μM, 3 min) in HepG2 (a), Huh‐7 (b), HL7702 (c), HEK‐hENT1 (d), and MDCK‐hOAT2 (e) cells. n = 5. *P < .05 in comparison with ETV‐alone group

The inhibitory effects of E2 and P4 at the indicated concentrations on the uptake of ETV (20 μM, 3 min) in HepG2 (a), Huh‐7 (b), HL7702 (c), HEK‐hENT1 (d), and MDCK‐hOAT2 (e) cells. n = 5. *P < .05 in comparison with ETV‐alone group