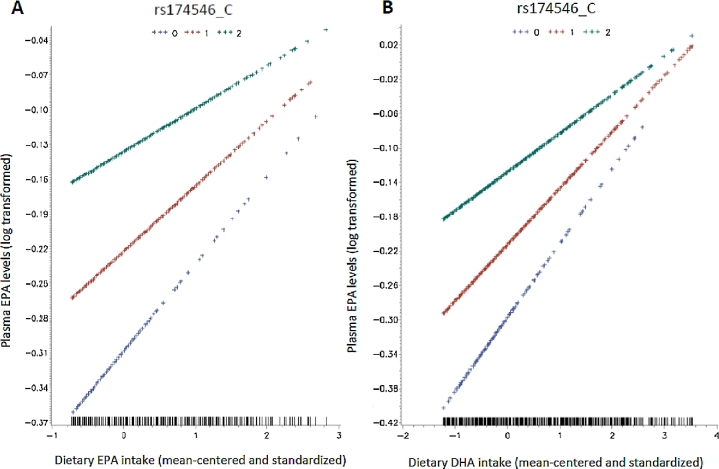
FIGURE 1.
Interactions between FADS1 SNP rs174546_C and dietary EPA (A) and DHA (B) intakes on circulating EPA proportions were tested via likelihood ratio tests by including a cross-product term of dietary EPA and DHA intake by rs174546_C allele numbers in the linear regression models. The top lines represent those who are homozygous for the C allele (C/C), the middle lines represent those who are heterozygous (C/T), and the bottom lines represent those who are homozygous for the T allele (T/T). The y axis shows the log-transformed plasma EPA proportions. The x axis shows the mean-centered and standardized intake amounts of EPA and DHA. FADS1, fatty acid desaturase 1; SNP, single nucleotide polymorphism.

