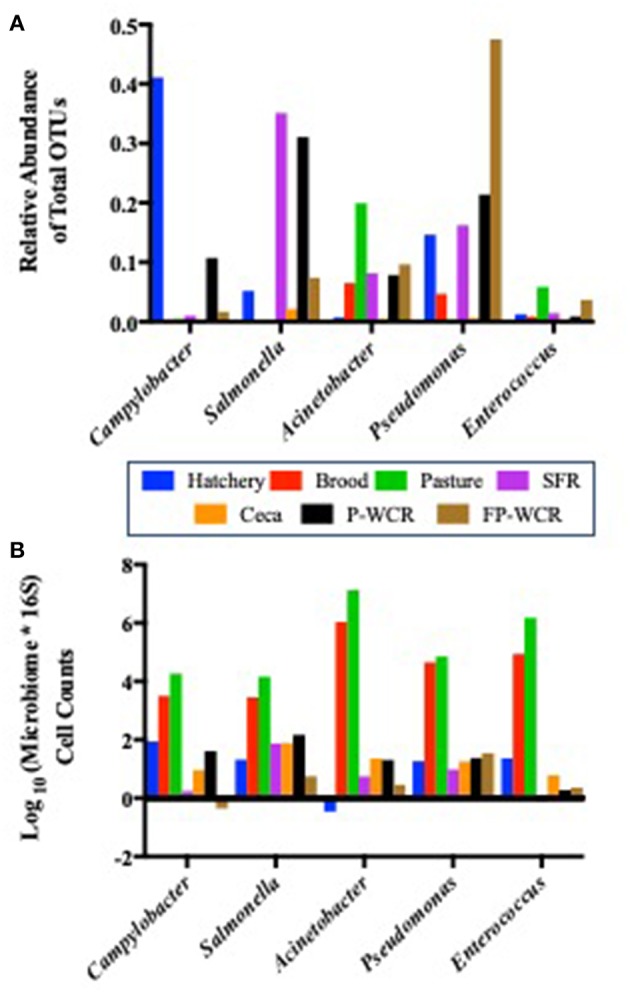
Figure 6.

Prevalence of five core zoonotic taxa within the total microbiomes from different sample types and stages along the farm-to-fork continuum of a pasture-raised broiler flock. (A) Relative abundances of the five core zoonotic taxa within the total microbiomes (430 total taxa). (B) Log10-transformed quantified microbiome cell counts of the five core zoonotic taxa, based on multiplying the microbiome relative abundance data by the total bacterial counts for each sample according to 16S qPCR analysis.
