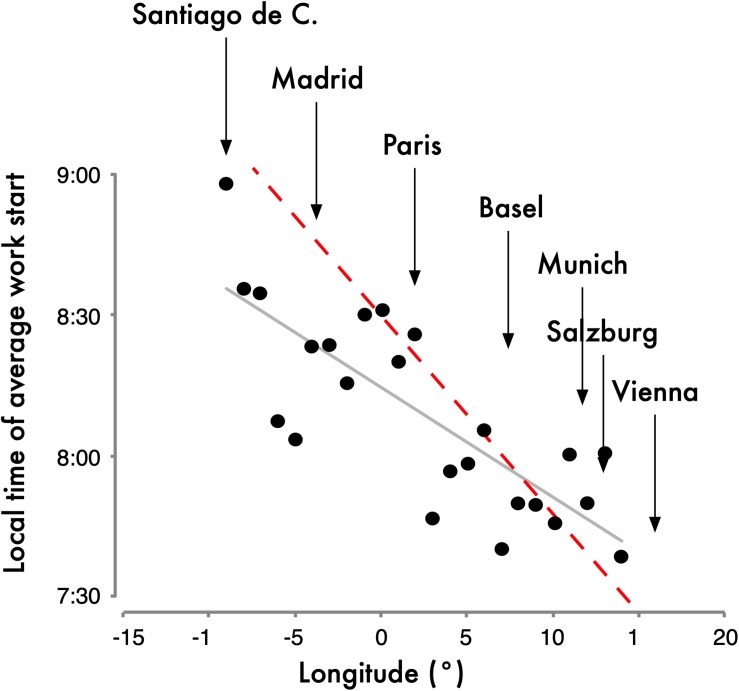
FIGURE 3.
Work-start times averaged for longitudinal bins of the Central European Time (CET) Zone. Data were taken from the MCTQ database. For the analysis, participants had to live in the CET zone and their postal code and city name had to match as they were used to derive latitude and longitude. The dashed red line represents the slope parallel to the progression of sunrise (4 min/longitude). The slope of the actual east-west delay (gray line) in work start times is 2.3 min/longitude (n = 24; r2 = 0.63; p < 0.001). This delay in work-start times despite identical local times is noteworthy since the slope of sleep timing on work-free days is 3.8 min/longitude for rural regions, 2.6 min/longitude for towns with populations between 300,000 and 500,000 and 1.5 min/longitude for the major European cities, perhaps due to the differences in lighting patterns and zeitgeber strength in those environments (Roenneberg et al., 2007b). The geographical location of some major European cities is indicated above the graph. Note that while all cities listed here are currently in the CET zone, some of those cities’ longitude is outside the non-political longitude lines for CET and therefore the graph has cities from –15° to +15° instead of –7.5° to +7.5° (see color-coded time zones in Figure 2). Data originally published in Roenneberg et al. (2019).

