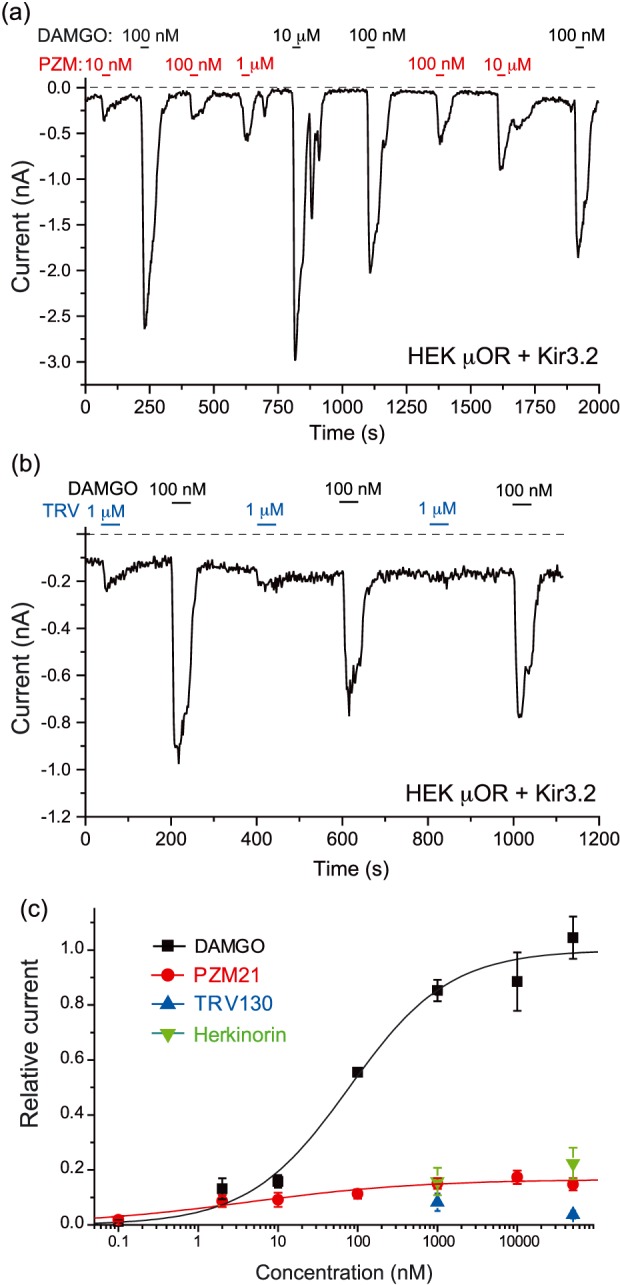
Figure 5.

Differential activation of Kir3.2 channels by μ receptor (μOR) agonists in HEK293 cells. Whole‐cell patch‐clamp measurements in HEK293 cells transfected with μ receptor and Kir3.2 channels were performed as described in Section 2. (a–b) Representative traces for inward (−100 mV) currents induced by the various μ receptor agonists. (c) Summary of the concentration–response relationship for DAMGO (n = 6–21 cells), PZM21 (n = 7–16 cells), TRV130 (n = 7–8 cells), and herkinorin (n = 5–7 cells) for individual data points. Kir3.2 currents were measured as a difference in inward currents before the application of the agonist and the peak current induced by each agonist. All data points were first normalized to responses induced by 100‐nM DAMGO in the same experiment. The individual data points were fitted with the Hill equation using the Sigmoid fit function of Microcal Origin 8.0. For visualization, all data points were renormalized to the maximum effect of DAMGO calculated from the Hill fit
