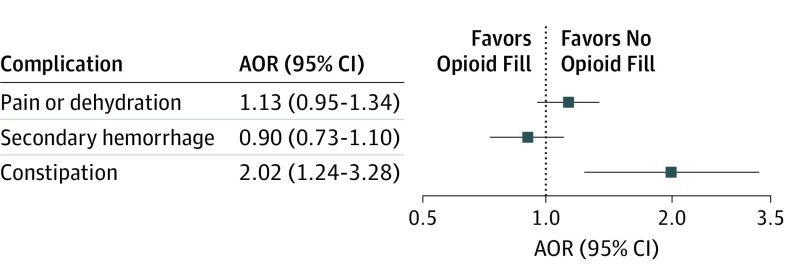
Figure 2. Adjusted Association Between 1 or More Perioperative Opioid Prescription Fill and Return Visits for Complications .
Squares represent the point estimate, and lines and whiskers represent the 95% CIs. Only the adjusted odds ratio (AOR) for constipation was statistically significant (ie, the 95% CI did not include 1.0). Regressions adjusted for demographic variables (age, sex, US census division, and median educational level by census block); an indicator of whether the surgeon was a pediatric or general otolaryngologist; an indicator of tonsillectomy alone vs tonsillectomy and adenoidectomy; and indicators of recent diagnoses of obstructive sleep apnea, mental health disorders, and other chronic conditions.

