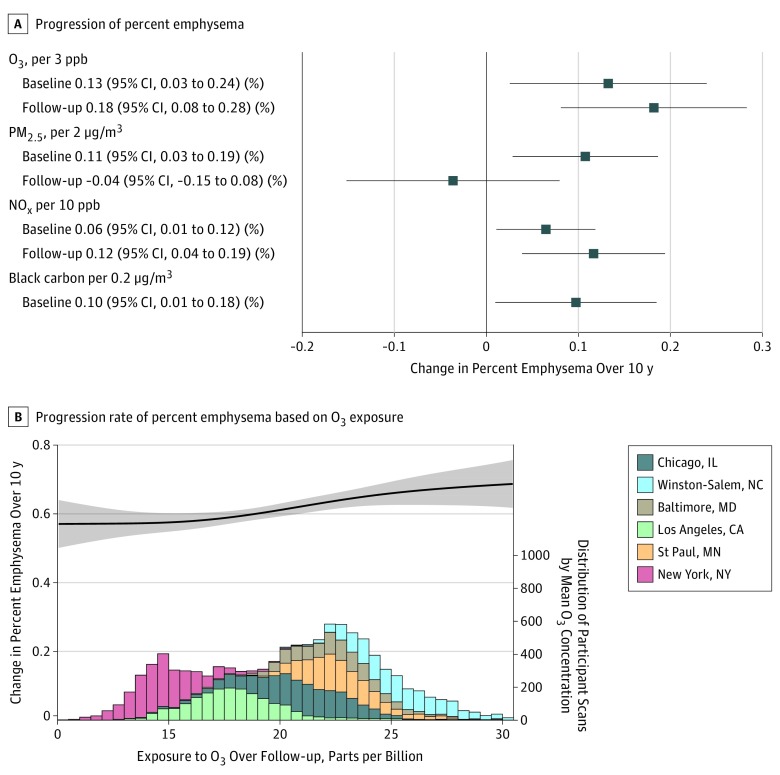
Figure 3. Longitudinal Associations of Exposure to Air Pollution With Progression of Percent Emphysema Over 10 Years in 6860 Participants .
A, The linear longitudinal association of baseline exposure to O3, PM2.5, and NOx in 2000 or 2006 to 2008 for black carbon (18 902 scans) and mean follow-up air pollution exposures from the year of the baseline examination to that of the follow-up clinic examination from 2000 to 2018 (18 574 scans) for each scan. Progression of percent emphysema shown via computed tomographic (CT) imaging (percentage of lung pixels less than −950 Hounsfield units) over 10 years shown from linear mixed model. Associations were presented per rounded interquartile range increment of exposure to O3, PM2.5, NOx, and black carbon. Models are adjusted for age, sex, race/ethnicity, height, weight, temperature, smoking status, secondhand smoking, pack-years, cigarettes per day, body mass index, physical activity, income, employment status, education, neighborhood socioeconomic status (SES) index, study region, the interaction between SES and study region, and interactions of these variables with time as well as variables without interactions with time, such as CT scanners, pixel size, and baseline exposure. B, The concentration-response curve with 95% CI for the overall change of percent emphysema (progression rate associated with O3 concentrations over follow-up) with the same model adjustments as in panel A. The curve is based on a mixed model that includes a thin plate regression spline with 4 degrees of freedom to more flexibly assess the potentially nonlinear relationship. The highest and lowest 1% of overall concentrations have been trimmed for visualization because the relationship at the extremes is uncertain and might rely on concentrations from a single region. The histogram shows the distribution of O3 concentration over follow-up in this cohort, with the contribution of each area to the total distribution indicated by color; the height of each bar in the histogram represents the number of scans analyzed in each 0.5 parts per billion (ppb) bin of O3 concentration.

