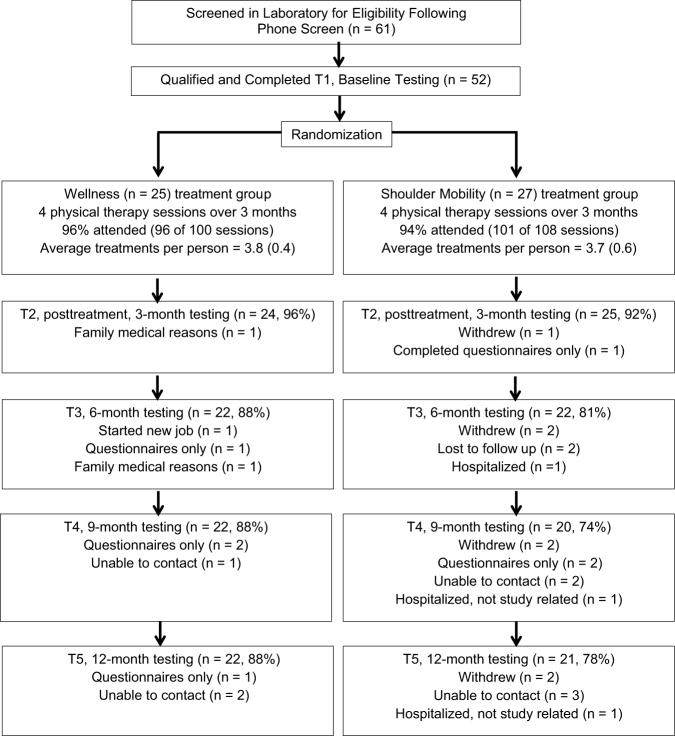
Figure 1.
CONSORT flow diagram including the number of people who attended each follow-up session and reasons people missed the follow-up session. Note that a participant could miss 1 follow-up session but remain in the study and attend subsequent follow-up sessions. T1–T5 = testing sessions 1 through 5.

