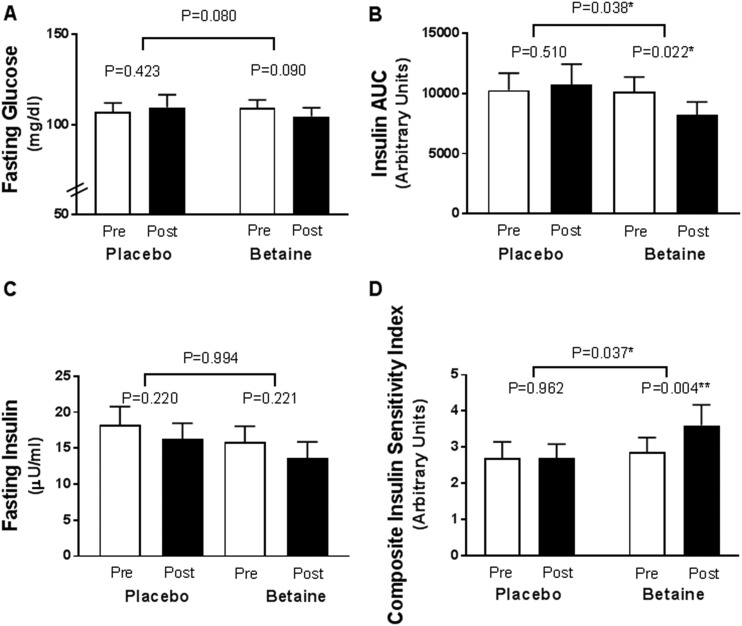
Figure 3.
OGTT-derived measures before and after 12 wk of treatment with betaine or placebo. (A) Fasting glucose. (B) AUC for insulin during the OGTT. (C) Fasting insulin. (D) The Matsuda Composite Insulin Sensitivity Index calculated as 10,000 divided by the square root of [(glucose × insulin) (glucosemean × insulinmean)]. Baseline pretreatment (white column); posttreatment (black column). *P < 0.05, **P < 0.01. AUC, area under the curve; post, after; pre, before.

