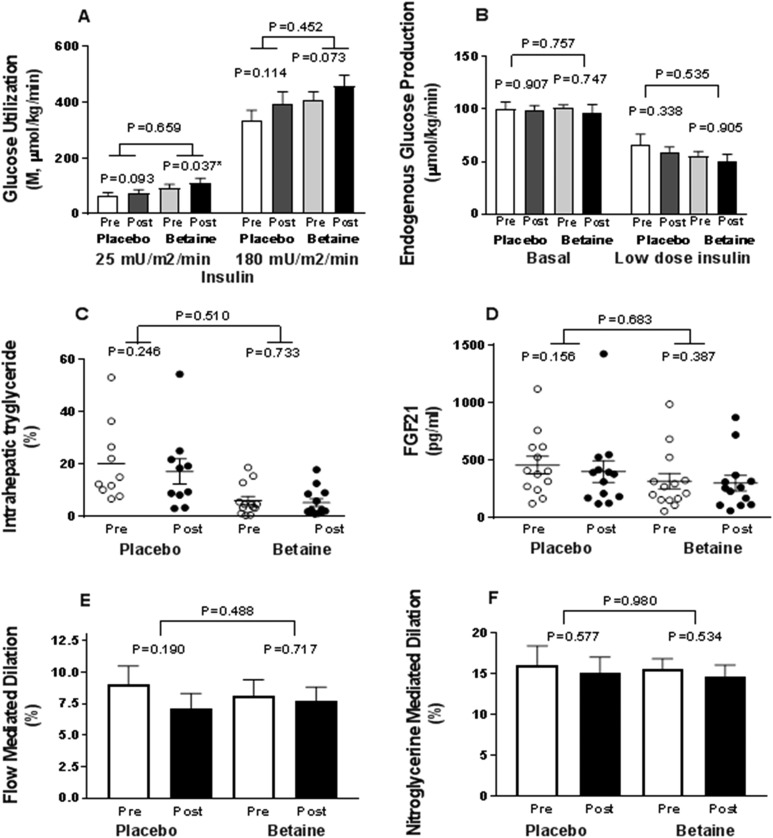
Figure 4.
Key metabolic end points at baseline and after 12 wk of treatment with betaine or placebo. (A) Insulin sensitivity is shown as M-values of glucose utilization during euglycemic-hyperinsulinemic clamp averaged over 90 to 120 mins and 210 to 240 mins, respectively, for each of two doses of insulin. (B) Endogenous glucose production: basal and clamp at low-dose insulin (25 mIU/m2/min). Placebo baseline (white column); placebo posttreatment (gray column); betaine baseline (light gray column); betaine posttreatment (black column). (B) Intrahepatic triglyceride measured by MRI and magnetic resonance spectroscopy is shown. (C) FGF21 concentrations are shown at baseline (○) and posttreatment (●). (D) Brachial artery flow-meditated dilation. (E) Brachial artery nitroglycerine-mediated dilation at baseline, pretreatment (white column), and posttreatment (black column). Post, after; pre, before.

