Fig. 2.

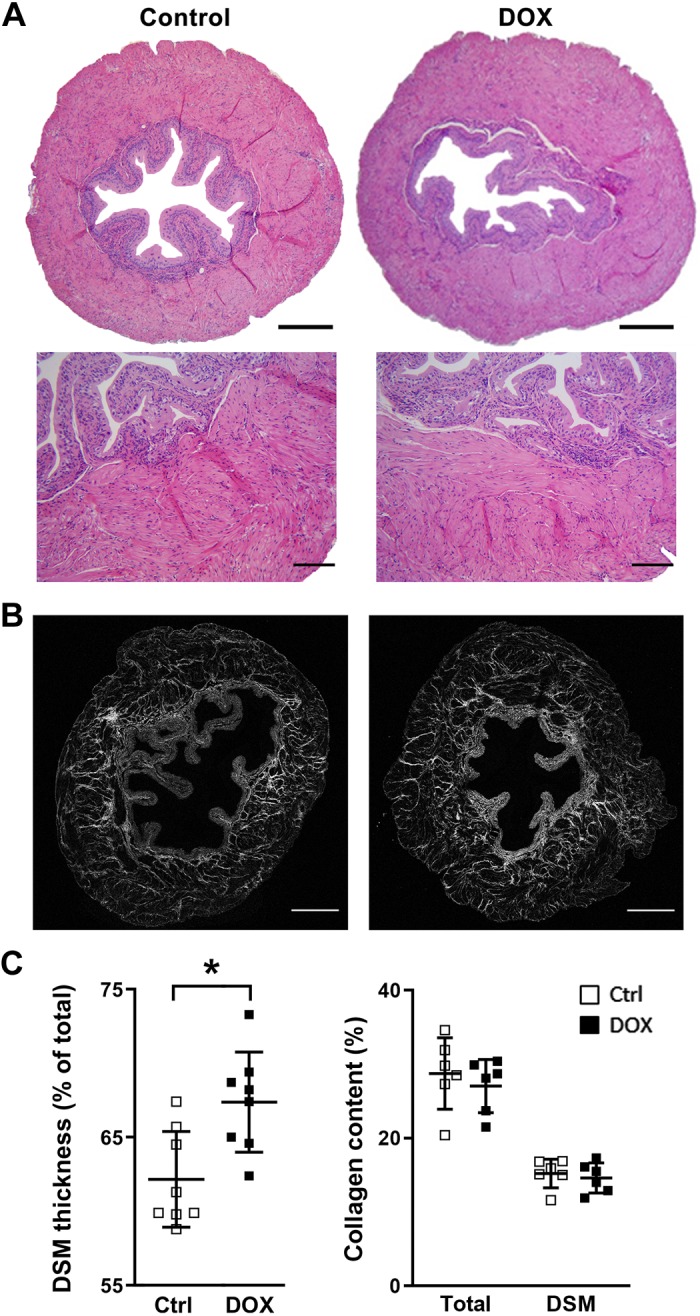
Bladder histology at 1 wk after the sixth administration. A: hematoxylin and eosin staining. Original scale bars = 400 µm (top) and 50 µm (bottom). B: collagen distribution (gray) in the bladder by second harmonic generation imaging. Original scale bars = 500 µm. C: thickness of the detrusor smooth muscle (DSM) layer relative to that of the total bladder wall (left). Values of the ratio of DSM to total tissue section areas represent means ± SE (in %). The total cross-sectional area was taken as 100%. Right, the collagen level in the total area and in the DSM layer. Values represent means ± SE (in %) to the areas of total tissue or DSM layer on each section, respectively; n = 4–5 per group. *P < 0.05 vs. the control (Ctrl) group. DOX, doxorubicin.
