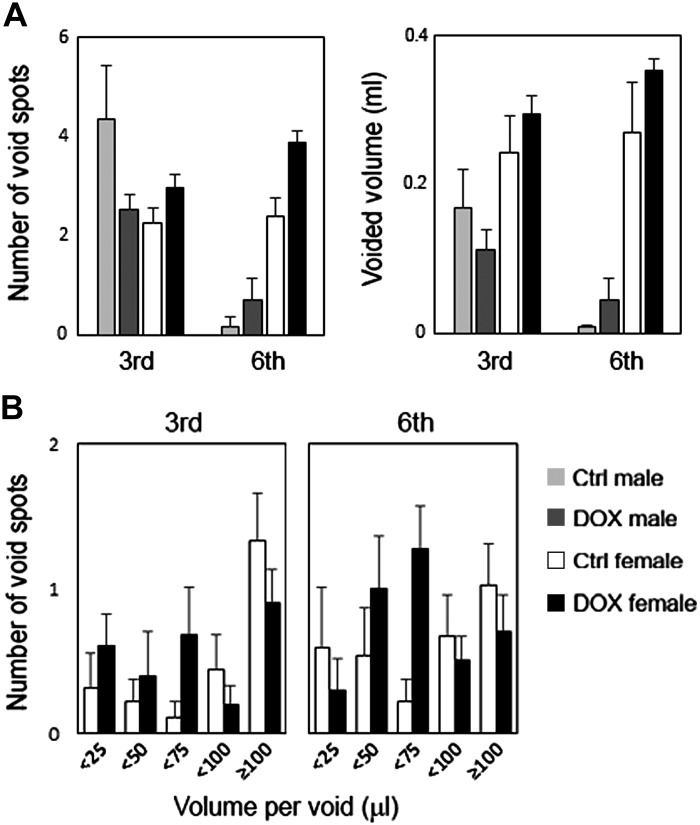
Fig. 3.
Micturition patterns in doxorubicin (DOX)-treated and control (Ctrl) groups at 6 days after the third and sixth administration. A: total number of urine spots (left) and total voided volume (right). B: number of urine spots of <25, 25–<50, 50–<75, 75– <100, and ≥100 µl per void in female mice. Values are means ± SE; n = 9–10 per group.

