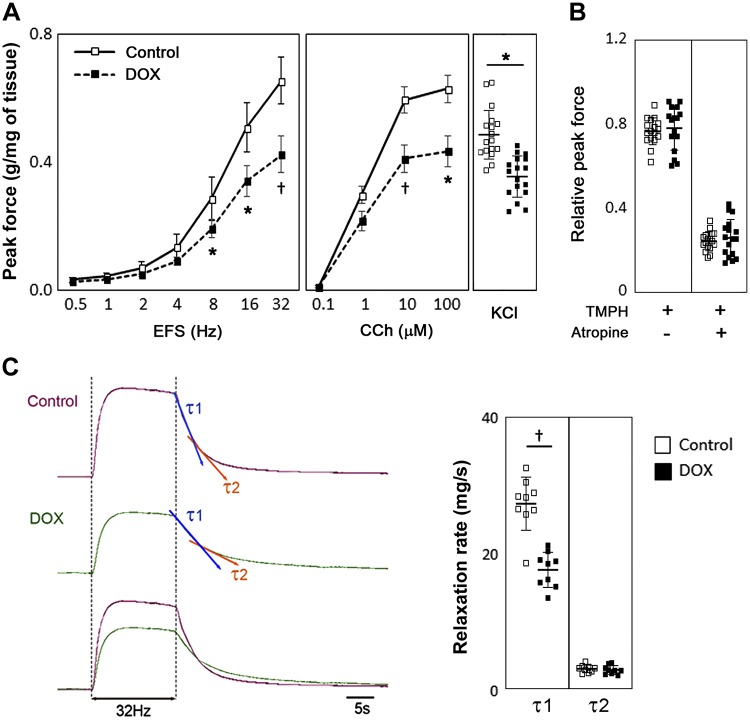
Fig. 4.
Contractility of bladder strips at 1 wk after the sixth administration. A: peak contractile force in response to electric field stimulation (EFS; left), carbachol (CCh; middle), and KCl (right; N = 10 and n = 17 per group, where N is the number of animals and n is the number of tissues used in the specific experiments). Solid lines and open boxes represent the control group; dashed lines and closed boxes represent the doxorubicin (DOX)-treated group. B: peak contractile force in response to EFS at 32 Hz with TMPH and atropine (muscarinic acetylcholine receptor inhibitor). Force was normalized with tissue weight and expressed as relative to the response to EFS in the absence of inhibitors. C: time constant (τ) of bladder strip relaxation upon the end of EFS (32 Hz). Left, representative response curves of contraction evoked by EFS and the following relaxation from each group. Each strip shows two different components of τ of relaxation: τ1 (blue arrows) and τ2 (orange arrows), indicating the fast and slow component of a relaxation curve, respectively. Right, summary of the detrusor smooth muscle relaxation rate (N = 6 and n = 9 per group). Force was normalized with tissue weight. Values are means ± SE. *P < 0.05 and †P < 0.005 vs. the control group.

