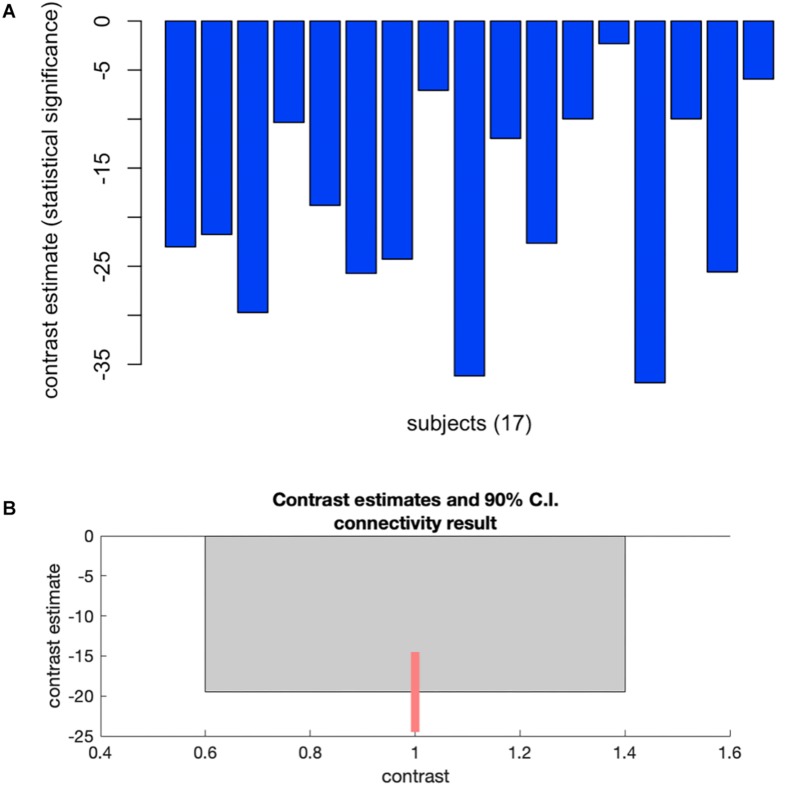
FIGURE 2.
Plots showing changes in whole-brain functional connectivity after a minimum of 60 days of estradiol therapy using multivoxel pattern analysis. (A) Plots individual changes in FC between the cluster within the subcallosal cortex and the rest of the brain. (B) Shows group average changes in FC (–19.51) between time points, with a 90% confidence interval (C.I: –25.4 to –13.52). Cluster size p-FDR <0.0013.

