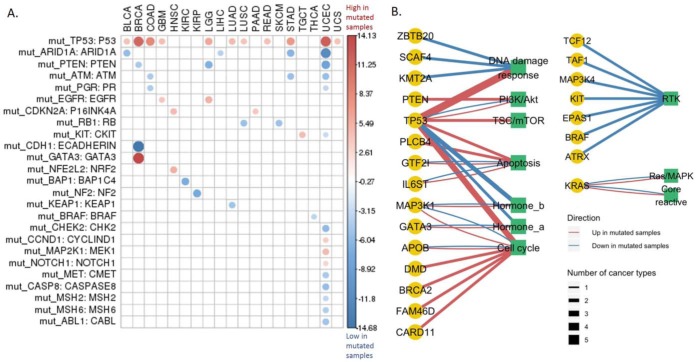
Fig. 2.
Protein expression affected by significantly mutated genes. (A) Protein expression change of the 299 SMGs across cancer types. Student's t test followed by multiple testing correction (FDR) was used to identify differentially expressed proteins among the mutated and wild-type groups defined by the mutational status of a gene. Only the differentially expressed proteins with FDR < 0.1 are shown. The circle size indicates the level of differential expression based on the t statistic values. The red/blue color indicates high/low protein expression in the mutated group. (B) Pathway activity impacted by the SMGs. Nodes are shaped and colored according to the data types. The yellow circles indicate the SMGs, and the green squares indicate the cancer pathways. The links between nodes are colored in red/blue to represent the up-/down-regulation of the pathway in the mutated group of an SMG. The line thickness represents how many cancer types show a significant correlation, and only those relationships observed in at least two cancer types are shown.

