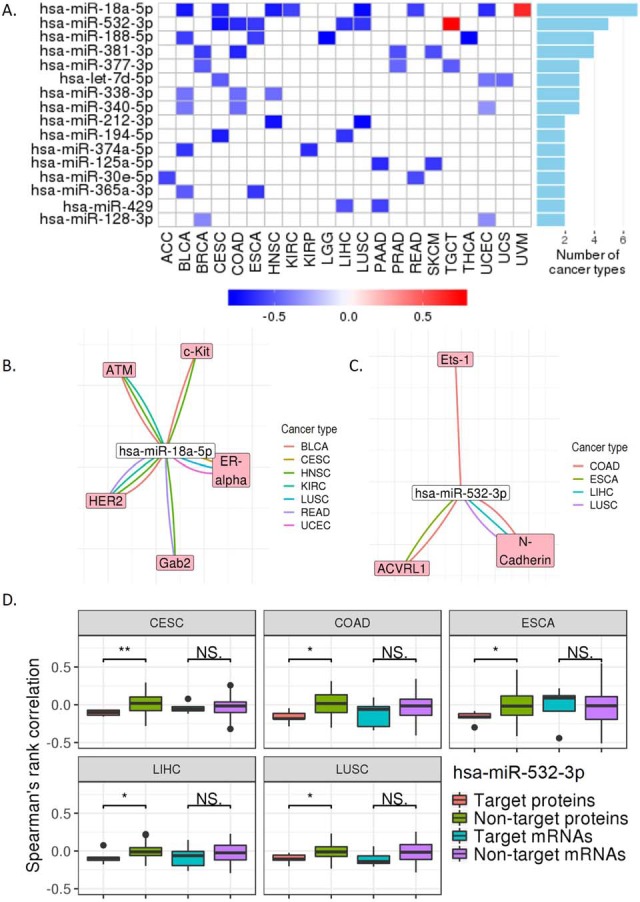
Fig. 4.

Protein expression regulated by miRNAs. (A) The miRNAs associated with protein expression. The regulatory signals from repression to activation are indicated on a low-to-high scale (blue-white-red) based on the KS test (p < 0.05). The bar plot on the right panel shows the numbers of cancer types that have repression observed. (B) and (C) Regulatory networks of the top-1 and top-2 miRNAs from (A). The negative correlations with significance are shown (Spearman's rank correlation, FDR < 0.1). (D) Box plots of Spearman's rank correlation coefficients of target proteins versus nontarget proteins at the mRNA and protein levels for has-miR-532–3p. KS test was used to assess the differences. *, p < 0.05; **, p < 0.01.
