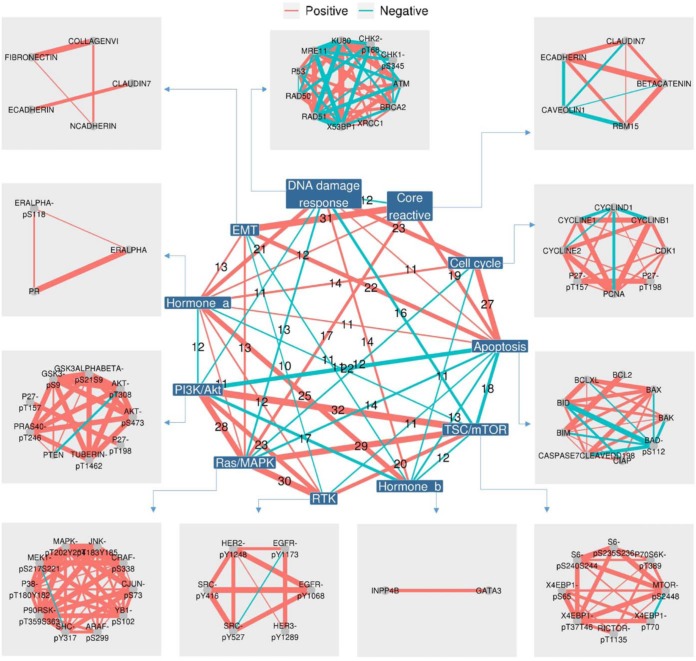
Fig. 5.
A nested co-expression network for proteins and cancer pathways. This nested co-expression network consists of an inner and an outer network, which, respectively, represents the connections between and within the 11 cancer pathways. The links between nodes are colored in red/green to indicate positive/negative correlations. The thickness of the links represents how many cancer types showing statistical significance (Spearman's rank correlation, FDR < 0.1). For simplicity, only the links supported by at least 10 cancer types are shown.

