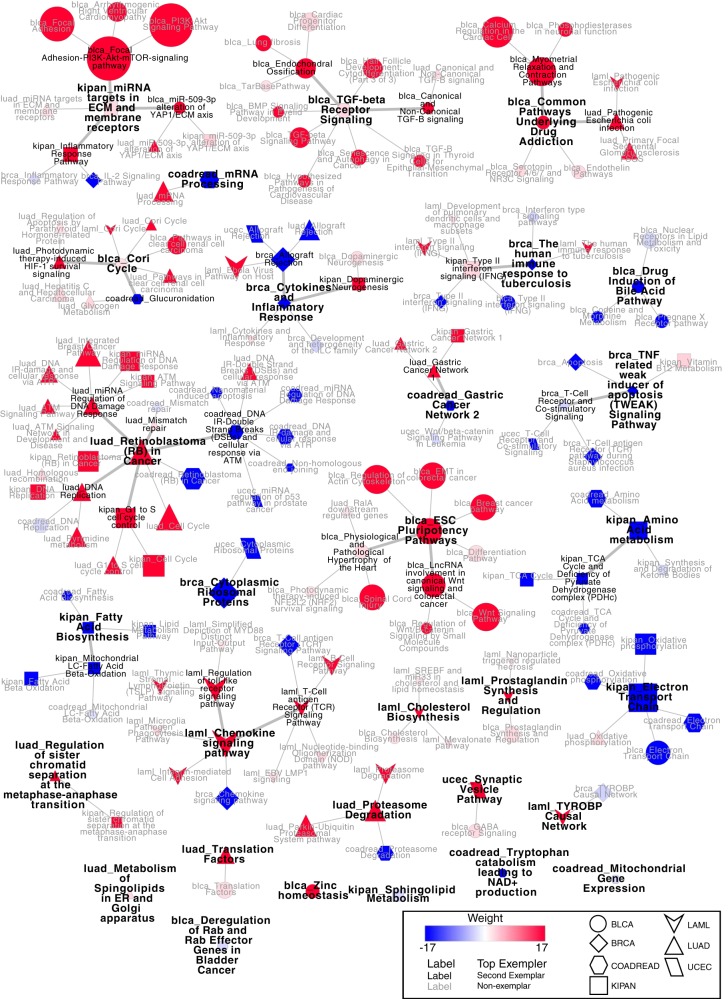
Fig. 7.
Pathways clusters from the pan-cancer survival analysis. Red nodes indicate a positive association with worse survival, whereas blue nodes indicate positive association with survival. The weight of the edge indicates the exemplar level, and the largest font indicates the cluster exemplar. The node shape identifies the cancer type.

