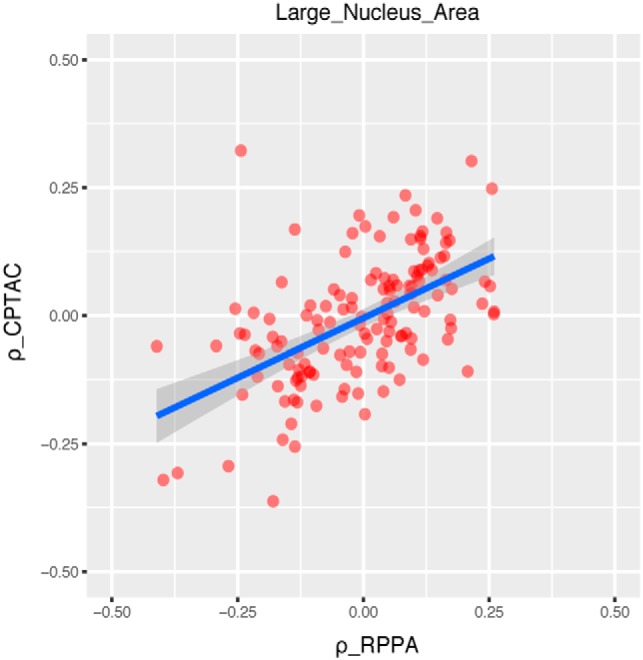
Fig. 2.

Validating relationships between morphological feature and proteomic data using RPPA data with an example (Large_Nucleus_Area). The correlation coefficient values show consistent distributions for image-RPPA proteomic data and image-CPTAC proteomic data. Each dot represents an image-gene pair with the x axis being the correlation coefficient between image-RPPA measurement (ρ_RPPA) and y axis being the correlation coefficient between image-CPTAC measurement (ρ_CPTAC).
