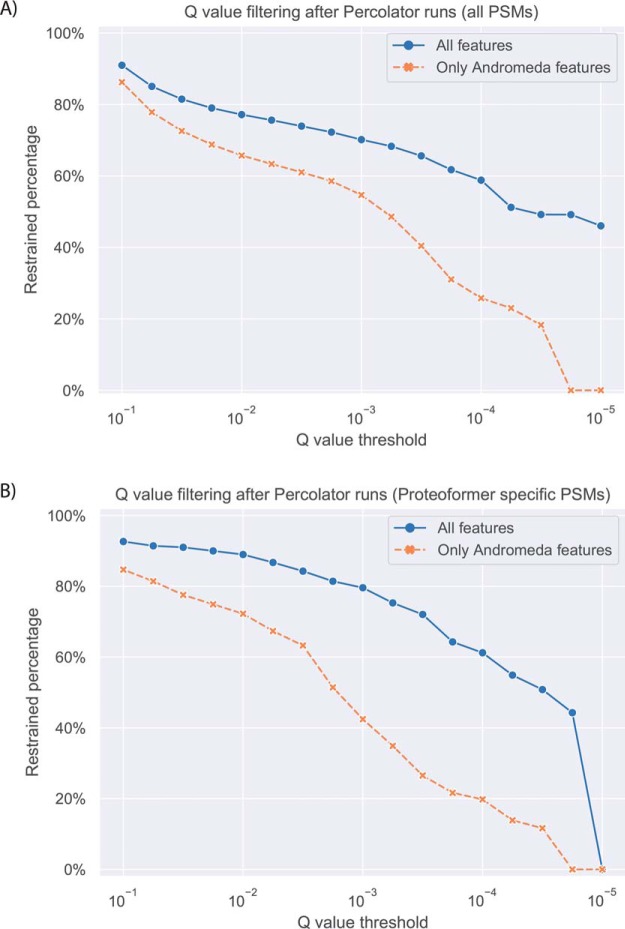
Fig. 5.
Comparison of the q values between a Percolator run with only Andromeda scores and a run with combined features from both Andromeda and Prosit. This analysis was executed for the HCT116 MS data searched against a combined redundant PROTEOFORMER database merged with the canonical version of UniProt. A, Analysis for all PSMs earlier identified with MaxQuant. B, Analysis of the PSMs earlier identified with MaxQuant because of sequences in the search space resulting solely from the PROTEOFORMER pipeline (i.e. novel proteoform events).

