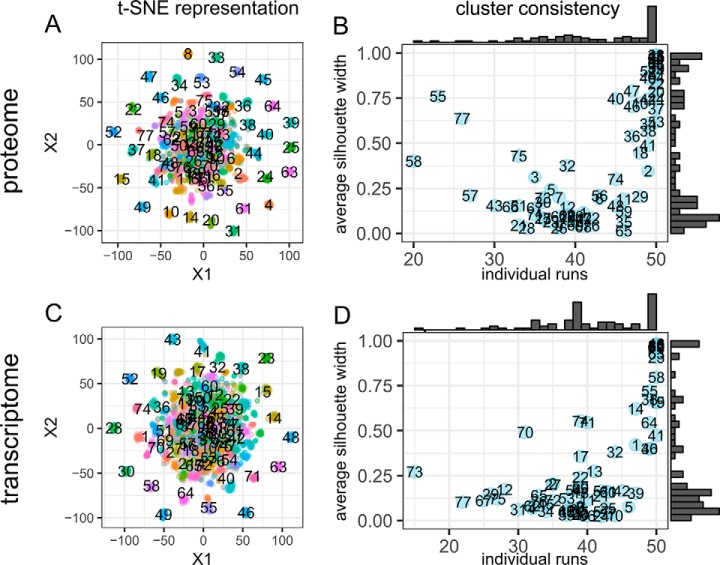
Fig. 2.
Evaluation of component consistency. A, C, t-SNE representation of components obtained from 50 randomly initiated runs of ICA workflow on the CPTAC BRCA retrospective data. Colors represent cluster assignments using the partition around medoids algorithm. B, D, average silhouette widths for the 77 clusters were plotted against the number of different individual runs from which the members of each cluster were extracted. Marginal histograms revealed the distribution of the metrics. Large values of individual runs indicate that the cluster is recurrent and larger values of silhouette width indicate that the cluster is more consistent. Both metric could be used to evaluate whether the cluster of components as a signature and more likely to capture true structures in the data.

