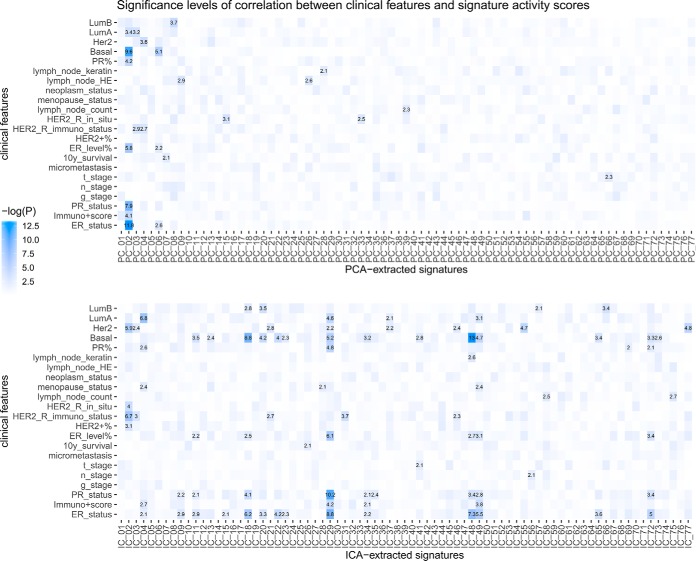
Fig. 4.
Comparison between PCA and ICA applications on the BRCA proteome data. Significance levels of association between clinical features and dimension-reduced representation of data obtained by PCA and ICA revealed the difference between the two methods. Association between each score and the clinical features are characterized by −log10 p value of linear regression slope coefficient.

