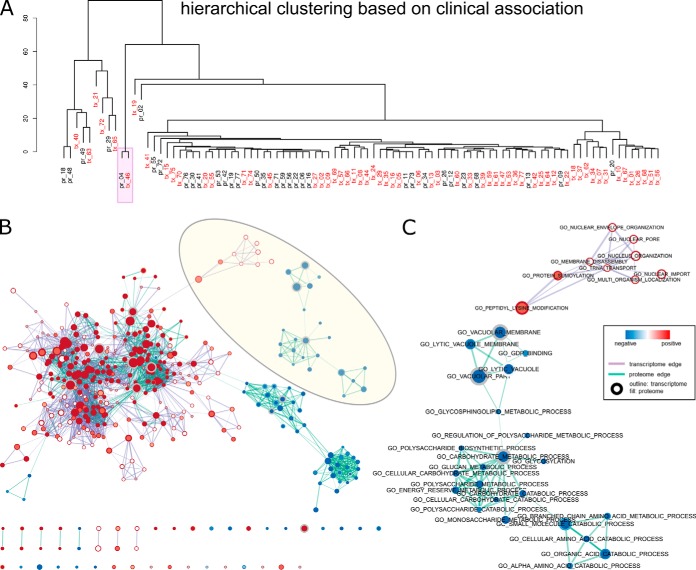
Fig. 6.
Integrative analysis of BRCA proteome and transcriptome signatures. Only clinically relevant IC clusters are shown (total count of significant associations >0). A, hierarchical clustering of the clinical association of all signatures. B, GSEA enrichment map of the combined network of cluster centers of pr_04 and tx_46 indicated in A. C, zoomed-in view of a transcriptome-specific (top) and a proteome specific subnetwork highlighted in B. Nodes represent the curated gene sets are colored according to the significance level (1-p value) and the direction of enrichment (positive as red and negative as blue). Displayed gene sets are filtered by a p value cutoff of 0.005 and a FDR cutoff of 0.1. The fill and outline of nodes exhibit enrichment of the proteomic signature and the transcriptomic signature, respectively, and the size of the nodes represents number of genes in the gene set. Thickness of the purple and cyan edges represents the number of shared genes between transcriptomic and proteomic nodes with significant enrichment.

