Fig. 2.
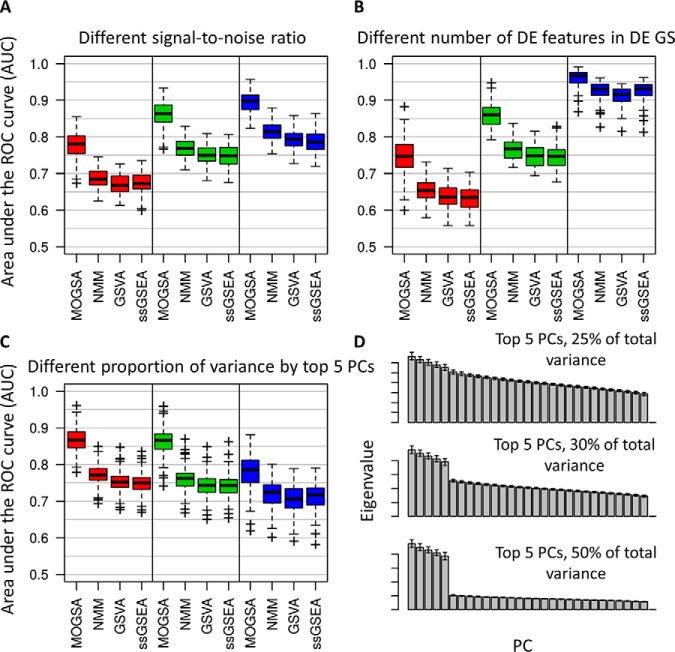
Comparison of MOGSA with NMM, GSVA and ssGSEA. The performance of each method was accessed by their ability to identify differentially expressed gene-sets over 100 simulations in every condition (as indicated by the area under the ROC curve; AUC). A, Comparison of GSA methods using data with different signal-to-noise ratios. From left to right, low (0.3), medium (0.5) or high (0.8) signal:noise ratio. B, Comparison of data with different number of differentially expressed (DE) genes in each of the DE gene-set. From left to right, 5, 10, and 25 of total 50 genes are differentially expressed in each of the three simulated data matrices if a gene-set is defined as DE gene-sets. C, Scree plots show representative eigenvalues in each of the conditions in (D). D, AUCs with different proportion of variance are capture by the top 5 components. From left to right, 25%, 30%, and 50% of total variance are captured. The darker bars represent the top 5 components.

