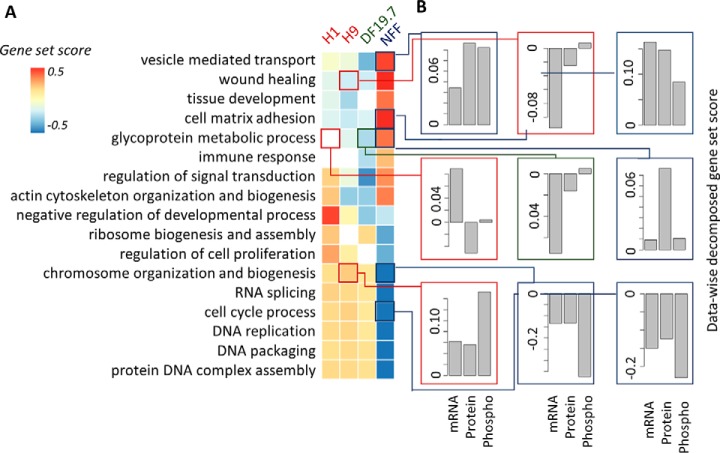
Fig. 4.
integrative gene-set analysis of iPS ES 4-plex data. A, Heatmap showing the gene-set score (GSS) for significantly regulated gene-sets in the cell lines. The white colored blocks/cells indicate that the change of gene-sets are non-significant (BH corrected p > 0.01). B, Data-wise decomposition of the GSS for some of the gene-sets. The contribution of each of the data is represent by a bar. The y-axis is the data-wise decomposed gene-set score.

