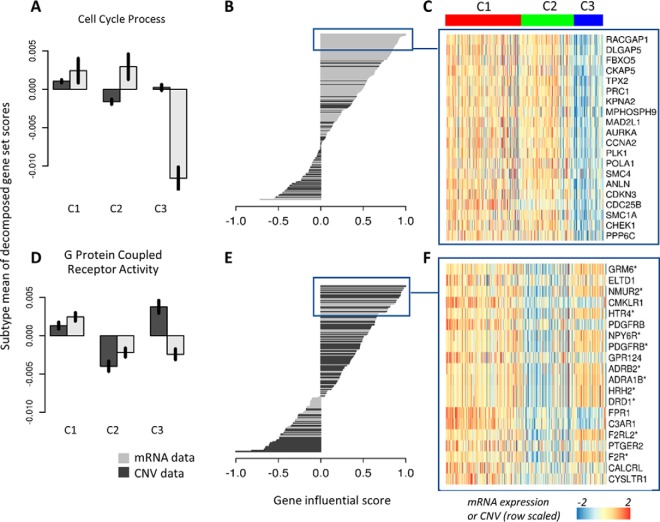
Fig. 6.
CNV and mRNA data contribute unequally to defining subtype and gene-set scores. A, Data-wise decomposition of gene-set scores for “cell cycle process.” The bar plot shows the normalized mean of data-wise decomposed GSSs in each subtype (the black vertical line on the bars show the 95% confidence interval of the mean). B, The bar plot shows the gene influential scores (GISs) of genes in the “cell cycle process” gene-sets. The expression of the top 30 most influential genes in the gene-set are shown in (C). D–F, Same as (A–C) for “G protein couple receptor activity.” Gene names in (F) with asterisks indicate genes from CNV data.

