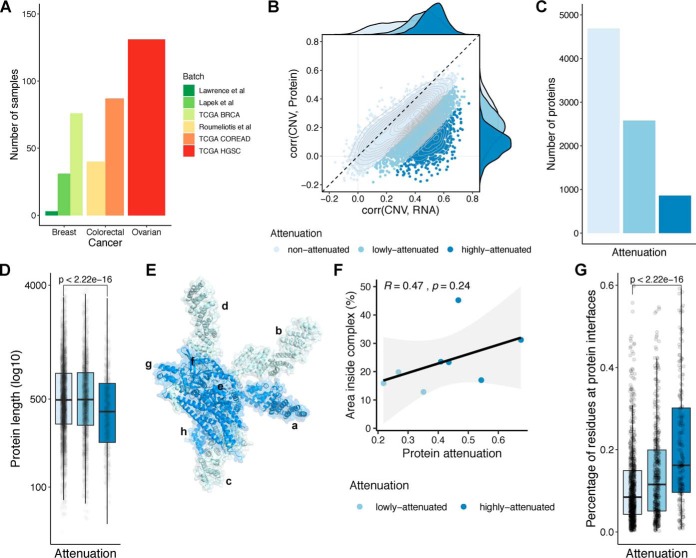
Fig. 1.
Features of proteins showing gene dosage buffering at the protein level. (A) Number of samples with CNV, mRNA, and protein measurements, by cancer type and batch. (B) Scatter plot representing the correlation between the CNV and mRNA (x-axis) and the CNV and protein (y-axis), for each gene. The colors represent the attenuation levels. From light blue to dark blue: nonattenuated, low attenuated and highly attenuated. (C) Number of proteins by attenuation level. (D) Protein length (log10 of number of residues) by attenuation level. (E) Representation of COP9 signalosome complex. (F) Scatter plot representing the correlation between the attenuation potential (x-axis) and the fraction of residues at interfaces in the complex (y-axis), for the eight protein subunits from the COP9 signalosome complex represented in (E). (G) Percentage of residues at protein interfaces by attenuation level.

