Fig. 3.
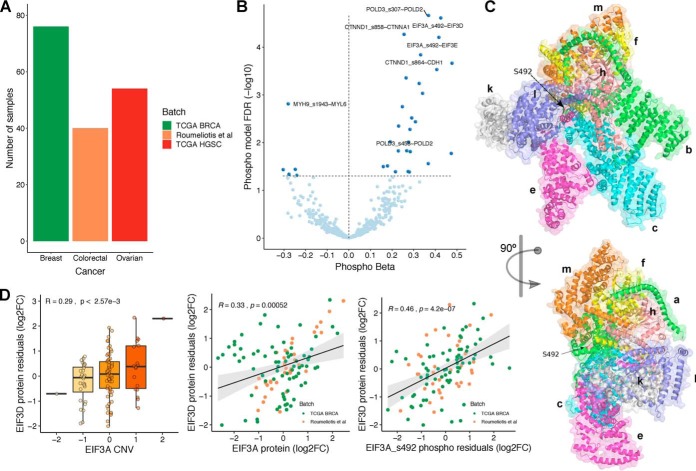
Identification of phosphorylation sites with a potential role in regulating protein interactions. (A) Number of samples with CNV, mRNA and phospho(protein) measurements, by cancer type/batch. (B) Volcano plot of phospho beta (x-axis) and FDR (y-axis). Each dot is a phosphosite–protein association, between a putative regulatory phosphosite Xp and a regulated protein Y. All associations (438) are significant in the CNV and mRNA models between the putative regulatory protein X and the regulated protein Y. 32 associations (FDR < 5%) are also significant in the phospho model (dark blue). (C) Representation of EIF3 complex in two orientations. The arrow points to the phosphosite S492 (serine 492) at EIF3A subunit. (D) Significant association between EIF3A/EIF3A S492 and EIF3D. The boxplots show the agreement between the CNV changes of EIF3A and the protein residuals (log2FC) of EIF3D. The scatter plots show the same relation with the protein and phosphosite (S492) abundances of EIF3A.

