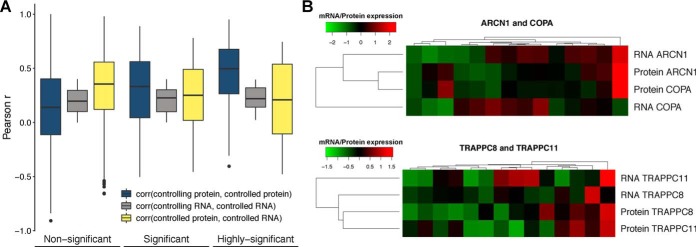
Fig. 4.
Evidence of interaction-mediated control of protein abundances in normal tissues. (A) Pearson correlation coefficient between the protein of the controlling and controlled genes (blue); mRNA of the controlling and controlled genes (gray) and mRNA and protein abundance of the controlled gene (yellow); for the nonsignificant associations (FDR > 5%), significant associations (1% < FDR < 5%) and highly significant associations (FDR < 1%). (B) Heatmap showing the agreement between the mRNA and protein expression profiles (rows) across tissues (columns) for two highly significant associations: ARCN1 (controlling) ∼ COPA (controlled) and TRAPPC8 (controlling) ∼ TRAPPC11 (controlled).

