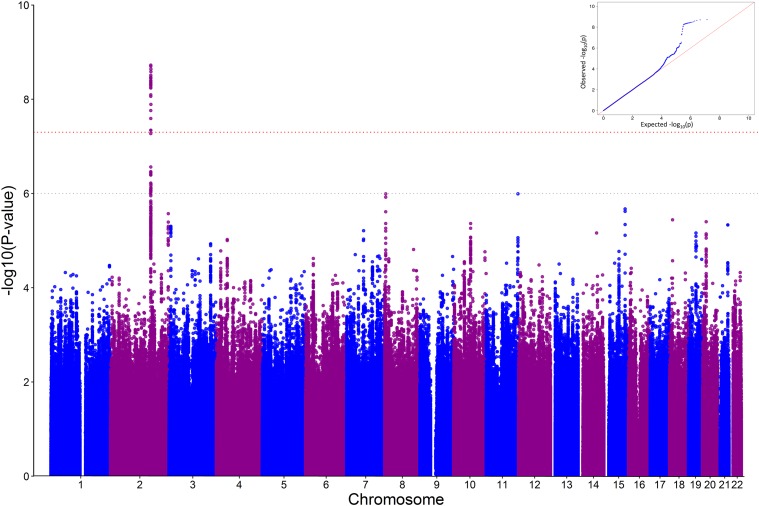
Figure 1.
GWAS results. A: Manhattan plot. Each dot represents a polymorphism (SNP). The x-axis depicts each chromosome and the y-axis shows the negative log10 P value for association of each SNP with DPN. The red dotted line indicates the genome-wide significance threshold of P = 5 × 10⁻⁸; the gray dotted line indicates the notable genome-wide significance threshold of P = 1 × 10⁻⁶. B: QQ plot (inset). The black dashed line indicates the null hypothesis. The blue line represents the observed log10 P values corresponding to the expected P values. λ = 0.994.

