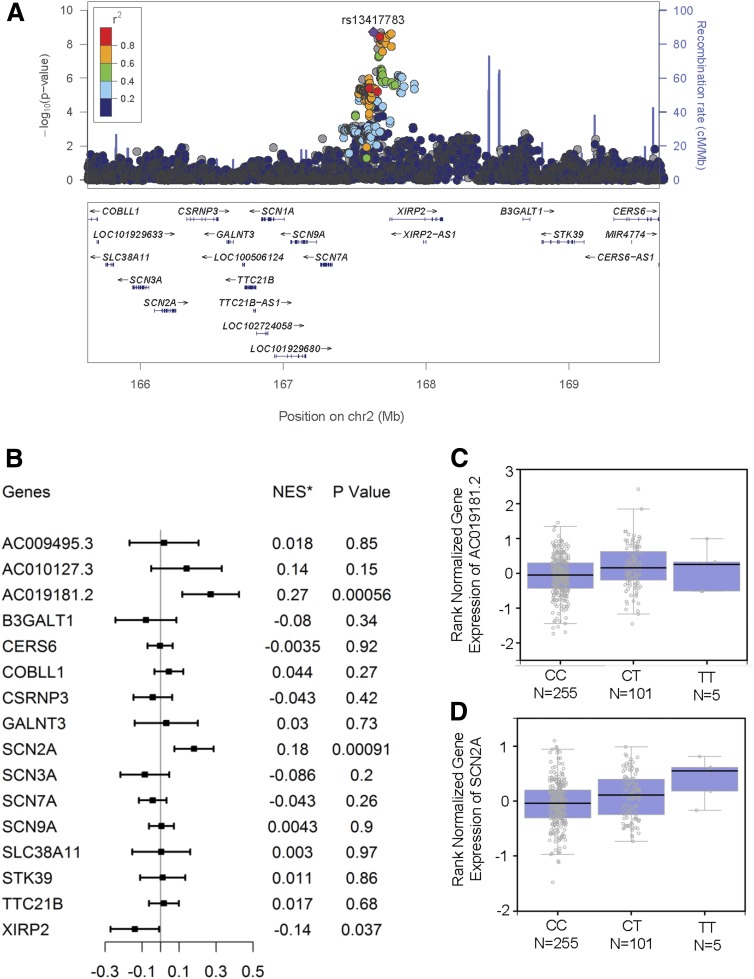
Figure 2.
Characterization of locus 2q24. A: Regional association plot of locus 2q24. Variants are displayed ±2 Mbp upstream and downstream of the lead SNP (rs13417783). The x-axis depicts the chromosomal positions of the SNPs according to National Center for Biotechnology Information Build 37, and the y-axis depicts the −log10 P values for association of these SNPs with DPN in ACCORD. SNPs in strong LD with the lead SNP (purple) are marked in red (r2 > 0.8). The bottom panel depicts genes from the University of California, Santa Cruz (UCSC) Known Genes data set within the region. The locus zoom plot was generated using LocusZoom (Abecasis Laboratory, University of Michigan School of Public Health) through http://locuszoom.sph.umich.edu/genform.php?type=yourdata. The reference database was hg19/1000 Genomes Nov 2014 European. B: eQTL analysis of locus 2q24 showing the association between rs13417783 and tibial nerve–specific expression of neighboring genes. The eQTL analysis was conducted on data from the GTEx database (http://www.gtexportal.org/home/). Genes were those located within ±2 Mbp from the lead SNP rs13417783. *NES is the normalized effect size, i.e., the slope of the linear regression between minor (T) allele dosage and gene expression. This effect size is computed in a normalized space where magnitude has no direct biological interpretation. C: Tibial nerve–specific expression of AC019181.2 stratified by rs13417783 genotypes. D: Tibial nerve–specific expression of SCN2A stratified by rs13417783 genotypes. Box plots were generated in GTEx.

